Fig. 2.
Download original image
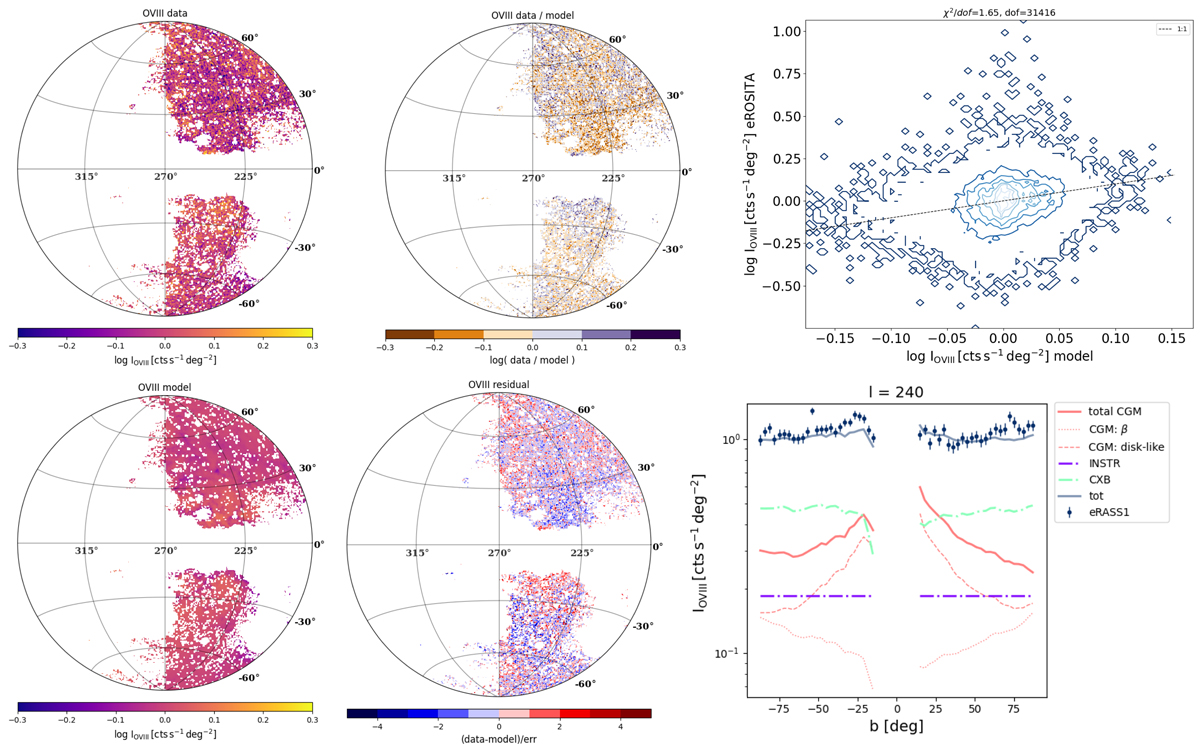
Fit results of the combined (β ≡ 0.5) density model to the O VIII eRASS1 intensity data. The four maps on the left-hand side show the eRASS1 selected data (top left) and the best-fit model intensities (bottom left; including all the background and foreground components and using the same color scale as the data); the logarithm of the ratio data/model in the range 10−0.3 ≃ 0.5 to 100.3 ≃ 2 (top center); and the residuals (data-model)/error (bottom center). The plots on the right show the data intensities against the predicted best-fit model intensities (top right) and an example latitudinal profile extracted along the l = 240 deg line (bottom right) highlighting the contribution of the different modeled components.
Current usage metrics show cumulative count of Article Views (full-text article views including HTML views, PDF and ePub downloads, according to the available data) and Abstracts Views on Vision4Press platform.
Data correspond to usage on the plateform after 2015. The current usage metrics is available 48-96 hours after online publication and is updated daily on week days.
Initial download of the metrics may take a while.