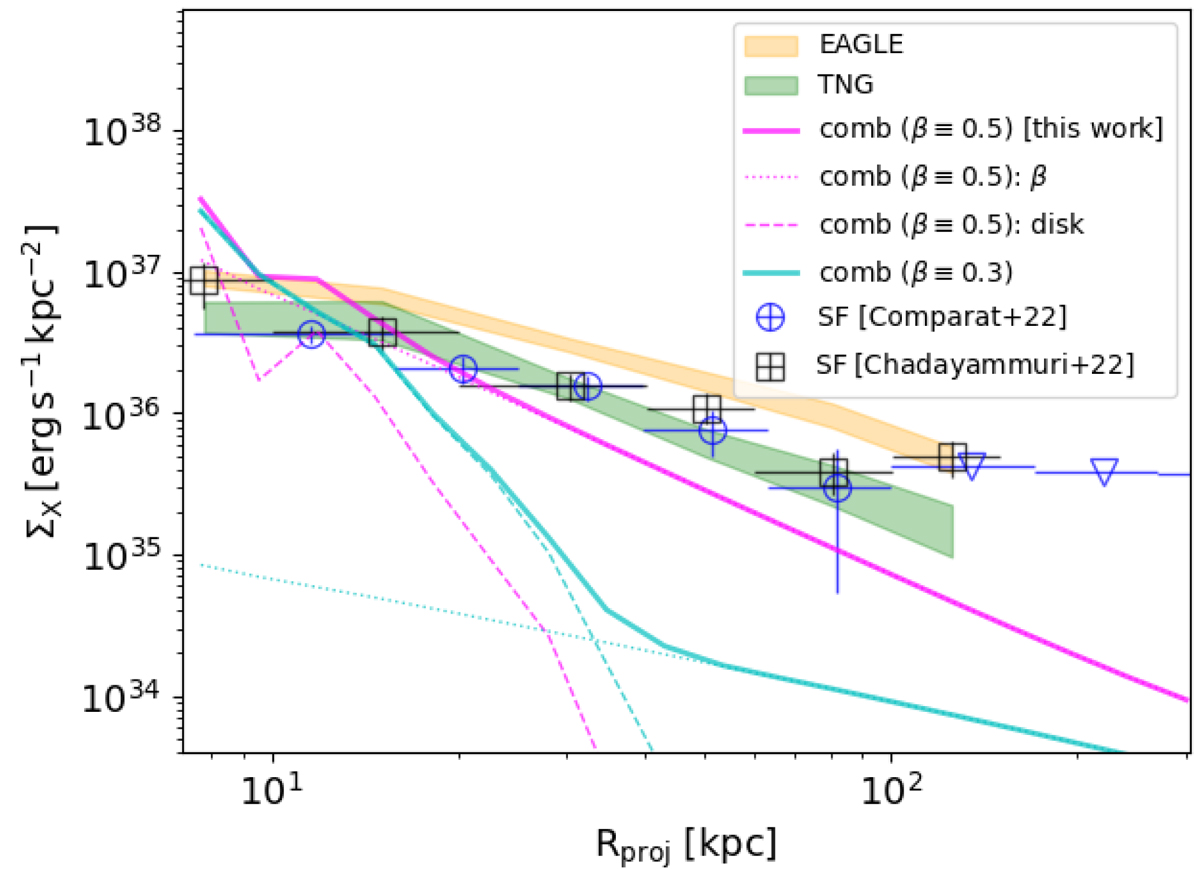
Fig. 13.
Download original image
Projected surface brightness profile ΣX as a function of projected distance Rproj from the Galactic center (as seen by an observer far from the MW) in comparison to stacking experiments (Comparat et al. 2022; Chadayammuri et al. 2022) and simulations (taken from Chadayammuri et al. 2022). The dotted and dashed lines show the β halo and disk-like emission components, respectively. The blue triangles indicate upper limits from Comparat et al. (2022).
Current usage metrics show cumulative count of Article Views (full-text article views including HTML views, PDF and ePub downloads, according to the available data) and Abstracts Views on Vision4Press platform.
Data correspond to usage on the plateform after 2015. The current usage metrics is available 48-96 hours after online publication and is updated daily on week days.
Initial download of the metrics may take a while.