Fig. 1.
Download original image
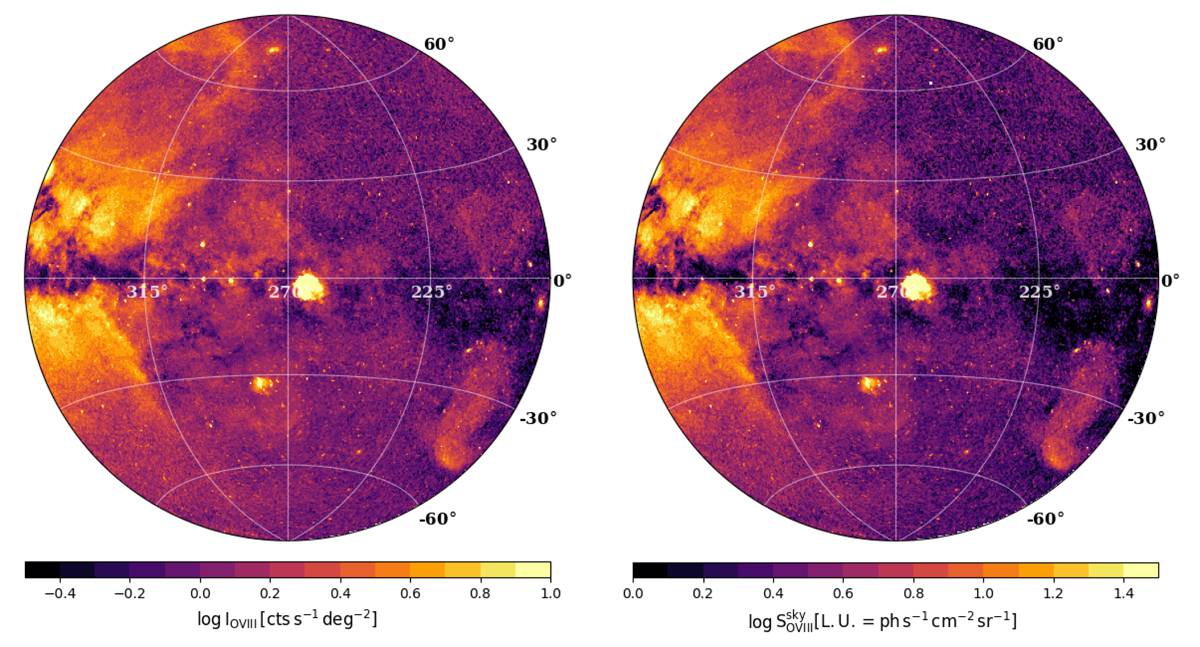
eRASS1 O VIII intensity data used in this work. Data are shown using a Zenith Equal Area projection in the Galactic coordinate reference frame and centered at (l, b) = (270, 0) deg throughout this work. We note that the left panel includes the contribution from the eROSITA instrumental background, and the sky flux was processed through the effective area of eROSITA. The right panel shows the same map, but the instrumental background has been subtracted, leaving the signal from the sky (see Eq. (2)). We divided the sky signal by the eROSITA effective area to obtain the surface brightness of the physical sky signal in line units (L.U. = ph s−1 cm−2 sr−1).
Current usage metrics show cumulative count of Article Views (full-text article views including HTML views, PDF and ePub downloads, according to the available data) and Abstracts Views on Vision4Press platform.
Data correspond to usage on the plateform after 2015. The current usage metrics is available 48-96 hours after online publication and is updated daily on week days.
Initial download of the metrics may take a while.