| Issue |
A&A
Volume 681, January 2024
|
|
|---|---|---|
| Article Number | A80 | |
| Number of page(s) | 12 | |
| Section | Celestial mechanics and astrometry | |
| DOI | https://doi.org/10.1051/0004-6361/202347031 | |
| Published online | 18 January 2024 | |
Characterisation of chaos and mean-motion resonances in meteoroid streams
Application to the Draconids and Leonids
IMCCE, Observatoire de Paris, PSL Research University, CNRS, Sorbonne Université,
UPMC Univ. Paris 6,
Univ. Lille,
France
e-mail: This email address is being protected from spambots. You need JavaScript enabled to view it.
Received:
28
May
2023
Accepted:
26
September
2023
Abstract
Context. Dynamically linking a meteor shower with its parent body is challenging, and chaos in the dynamics of meteoroid streams may contribute to this challenge. For a robust identification of parent bodies, it is therefore necessary to quantify the amount of chaos involved in the evolution of meteoroid streams.
Aims. Characterising chaos in meteoroid streams through the aid of chaos maps is still a new field of study. Thus, we examine two very different meteoroid streams, the Draconids and the Leonids, in order to obtain a general view of this topic.
Methods. We used the method developed in a previous paper dedicated to Geminids, drawing chaos maps with the orthogonal fast Lyapunov indicator. We chose four particle size ranges to investigate the effect of non-gravitational forces. As the dynamics are structured by mean-motion resonances with planets, we computed the locations and widths of the resonances at play. We used semi-analytical formulas valid for any eccentricity and inclination and an arbitrary number of planets.
Results. We pinpoint which mean-motion resonances with Jupiter play a major role in the dynamics of each meteoroid stream. We show how those resonances tend to trap mostly large particles, preventing them from meeting with Jupiter. We also study particles that manage to escape those resonances, for example, due to the gravitational perturbation of Saturn. Finally, we explain why non-gravitational forces do not disturb the dynamics much, contrary to what is observed for the Geminids.
Key words: gravitation / chaos / methods: numerical / celestial mechanics / meteorites, meteors, meteoroids
© The Authors 2024
 Open Access article, published by EDP Sciences, under the terms of the Creative Commons Attribution License (https://creativecommons.org/licenses/by/4.0), which permits unrestricted use, distribution, and reproduction in any medium, provided the original work is properly cited.
This article is published in open access under the Subscribe to Open model. This email address is being protected from spambots. You need JavaScript enabled to view it. to support open access publication.
1 Introduction
The ability to predict meteor showers is based on the knowledge of their parent bodies. In the absence of such knowledge, a hypothesis about their origin must first be made (Lyytinen & Jenniskens 2003; Vaubaillon & Jenniskens 2007; Jenniskens & Vaubaillon 2008; Jenniskens 2008). However, even the initial conditions of the meteoroid stream are determined on the basis of the existence of a meteor shower. Out of the numerous meteors recorded in the past two decades at least, nearly 1600 showers in total are in the International Astronomical Union (IAU) list of meteor showers1. However, many of them are probably not genuine meteor showers. The very identification of meteor showers is an area of research in itself, and the definition of a robust method to identify them is currently under study (Gartrell & Elford 1975; Neslušan & Hajduková 2017; Jopek et al. 2023). In particular, a meteor shower can only be recognised if the meteoroid orbits are similar to each other at the time of observation. This implies that these orbits are also stable enough between the time of their ejection from the parent body and the observation such that their trajectories do not diverge substantially. Quantifying the orbital similarity has also been the subject of many efforts in the past, yet such efforts have only yielded inconclusive results (Williams et al. 2019).
In order to help in the effort of establishing the existence of meteor showers, we used a method to quantify the chaoticity in meteoroid streams as a function of meteoroid size and time (Courtot et al. 2023). Chaoticity is indeed highly size dependent as a result of non-gravitational forces (NGFs), as one could expect (Liou & Zook 1997). Our previous study focused on the Geminids meteoroid stream, whose parent body asteroid, 3200 Phaethon, is known to have a very stable orbit for 10 kyrs (Williams & Wu 1993; Ryabova et al. 2019). The case of the Geminids was therefore a good way to characterise the performance of the developed method and its ability to detect chaos in a relatively weak chaotic orbit. Yet many meteoroid streams are more chaotic than the Geminids. Now that the tools described by Courtot et al. (2023) are well established, we are able to characterise chaos in various streams linked to verified meteor showers, creating a general view of what chaos in verified meteor showers can look like. This view can serve as a point of reference for future studies of groups of meteors whose identity as meteor showers is not yet certain. In chaos maps related to verified meteor showers, we will look for characteristics that do not appear in maps drawn from the chance association of meteors. Ultimately, it will allow us to distinguish between meteor showers and chance associations of meteoroids.
This paper focuses on two well-known yet very different meteor showers associated with a Jupiter family comet (JFC) and a Halley-type comet (HTC). The Draconids meteor shower is caused by the JFC 21P/Giacobini-Zinner, which is known to have had its last very close encounter with Jupiter in 1898 (closest distance: 0.24 au). Such encounters also happen for the associated meteoroid stream, presumably at a much higher frequency, as the stream has expanded a lot in the interplanetary space after a few revolutions, giving it a much larger impact cross-section than the comet itself. Close encounters with giant planets are responsible for the stream dispersion in the Solar System (with the result of gradually losing the dynamical signature of its parent body because of chaotic diffusion), brutal changes in the orbits of meteoroids, and rather complicated processes (for a full review, see Vaubaillon et al. 2019). The Draconids activity is characterised by occasional outbursts of various strength (Egal et al. 2019). In case of an outburst, meteoroids are densely packed in a restricted region of the parameter space, but they may then disperse because of chaos, which needs to be quantified. In comparison, the Leonids associated with HTC 55P/Tempel-Tuttle are dynamically less chaotic, since close encounters with Jupiter are less frequent for them. Their activity is also characterised by dramatic outbursts or even storms (Wu & Williams 1996; McNaught & Asher 1999). The high level of some shower outbursts is caused by young and densely populated trails colliding with the Earth. The influence of the Earth in the stream is negligible most of the time and causes small gaps in the trail (Vaubaillon et al. 2019). In this paper, we aim to quantify the level of chaos in these two drastically different streams. Following the method developed by Courtot et al. (2023), our chaos maps are drawn as a function of time and meteoroid size.
In Sect. 2, the method is briefly recalled, and the specificity of the studied streams is described. In Sect. 3, a method to compute the width of mean-motion resonances (MMRs) for meteoroids is presented. In Sect. 4, the results on the Leonids and Draconids meteoroid streams are shown. More precisely, we explore the role of MMRs with Jupiter, as well as close encounters with several planets. We also investigate the impact of NGFs. We conclude in Sect. 5.
2 Method
We have described our method in depth in our previous article (Courtot et al. 2023). In this work, we only report the main points and the specifics of this study.
Drawing chaos maps requires a chaos indicator, and we chose the orthogonal fast Lyapunov indicator (OFLI) from Fouchard et al. (2002) since it suits our problem and purpose. Because of the NGFs, our problem is dissipative, and therefore we cannot use a symplectic integrator. Because we also expect many close encounters, an integrator with a variable time step is preferred. The integrator RADAU order 15 meets these two demands (Everhart 1985). The INPOP planetary ephemerides are used (Fienga et al. 2009). The NGFs taken into account are the Poynting–Robertson drag and the solar radiation pressure (Vaubaillon et al. 2005).
Each particle is described by its state vector (position and velocity) at time t and its radius. We assumed a density of ρ = 1000 kg m−3 in order to compute the mass. We chose different initial conditions for each meteoroid stream. We set the initial time t0 to 1901 AD for the Draconids and 1334 AD for the Leonids. The trail ejected at those times are known to be responsible for meteor outbursts on Earth in 1946 and 1998, respectively (McNaught & Asher 1999; Vaubaillon et al. 2011).
For each particle, the initial state vector was selected from the ranges of orbital elements described in Table 1 for the Draconids and Table 2 for the Leonids. The chosen ranges of orbital elements encompass a broad array of orbits characterising those streams and, specifically, the orbits resulting from simulations using the model developed by Vaubaillon et al. (2005). More precisely, for each particle, the orbital elements were picked randomly in those ranges, and the initial state vector was computed. We decided on a random selection based on our experience with the Geminids (see Courtot et al. 2023). The mean anomaly is not described in the tables because we chose to cover the whole range of possible values (0–360°).
We also chose the radius of our particles. We created a first set of particles with a radius randomly chosen between 10 and 100 mm, which we called BIN10100. Then we created three other sets with the same constraints but with different bins of radii: 1– 10 mm (BIN110), 0.1–1 mm (BIN011), and finally 0.01 to 0.1 mm (BIN00101). We did not consider other sets of smaller particles because the NGFs would be heavily modified for such small particles and the radiation-matter interaction would pass into another regime. The sizes described in the various sets encompass most of what is observed in meteor showers. Each of the sets contains 100080 particles.
We then integrated the Draconids for 1000 years (about 170 periods) and the Leonids for 2000 years (about 60 periods) to study short- and mid-term behaviour of the streams without modelling their entire lifetime. In the integrations, a close encounter between a particle and a planet is detected when the particle is closer to the planet than its Hill radius. The parameters of the encounters are then recorded. The particle is not removed from the integration, no matter its distance from the planet. When a particle is closer than 0.02 au to the Sun or farther than 1000 au, it is removed from the integration. Such particles have not been plotted in the maps, and the number of them is sufficiently low that they do not pose a problem.
Range of heliocentric orbital elements of the Draconids.
Range of heliocentric orbital elements of the Leonids.
3 Computation of resonance widths
The orbital dynamics of meteoroid streams are shaped by MMRs with planets. On the chaos maps previously computed by Courtot et al. (2023) for the Geminids, resonances appear as chaotic belts (the resonance ‘separatrices’) surrounding stable zones. Because we expected MMRs to also play a decisive role in the dynamics of the Draconids and Leonids, we needed to locate the relevant resonances and determine their widths.
The traditional description of MMRs relies on the expansion of the disturbing potential in a series of eccentricity e and inclination i (see e.g. Laskar & Robutel 1995; Murray & Dermott 1999). For a given resonance, the leading-order term of the averaged series defines the ‘resonance angle’, whose behaviour sets the global dynamics of the system. This classical approach is only valid within the limit of low eccentricities and low mutual inclinations. In the case of meteoroid streams, eccentricities and inclinations can reach any value, including regions where the classical series expansion diverges (for instance e ≈ 0.7 and i ≈ 30° for the Draconids and e ≈ 0.9 and i ≈ 167° for the Leonids; see Tables 1 and 2). Even though the disturbing potential can in theory be expanded around arbitrary values (see e.g. Lei 2019; Namouni & Morais 2020), this approach still requires correctly identifying the relevant resonant harmonics in the truncated series. This process can be cumbersome for high-eccentricity and high-inclination orbits, since many harmonics simultaneously play a strong role, and their relative importance depends on the varying orbital elements of the particle.
As an alternative to series expansions, one can compute the resonant disturbing potential numerically (see e.g. Gomes et al. 2005; Gallardo 2006b,a; Gallardo et al. 2012). In this case, the resulting potential is exact, but the drawback is that we cannot solve the equations of motion explicitly. Yet a semi-analytical model of the long-term dynamics is still possible by using the so-called adiabatic invariant approximation (Lenard 1959; Henrard 1982; Wisdom 1985). The adiabatic approximation is commonly used in celestial mechanics to reduce a system with two well-separated timescales into a system with fewer degrees of freedom. Of particular interest are systems reducing to only one degree of freedom, as trajectories can be represented by the level curves of a conserved quantity. This is the case of the planar dynamics of small bodies in MMR with a planet (see e.g. Wisdom 1985; Beust & Morbidelli 1996; Beust 2016; Pichierri et al. 2017), or the spatial dynamics of small bodies perturbed by planets on coplanar circular orbits (see e.g. Gallardo et al. 2012; Saillenfest et al. 2016; Efimov & Sidorenko 2020; Saillenfest 2020; Lei et al. 2022). In this work, we are not interested in obtaining a fully integrable model for the long-term resonant dynamics but only computing the resonance widths. Therefore, a large number of degrees of freedom is not an issue as long as their variations are ‘slow’ (see below). Consequently, we may consider arbitrary orbits for both the small body and the planets.
Writing ε the characteristic size of planetary perturbations, the adiabatic approximation consists of taking advantage of the large separation of timescales between the oscillation of the small body inside a MMR (frequency proportional to ε1/2) and the orbital precession of the small body and the planets (frequencies proportional to ε1). We outline in this section the semi-analytical method of Gallardo (2019, 2020), which we adapted to the motion of a small body under the influence of any number of possibly inclined and eccentric planets. The background of the equations is given in Appendix A, where we show that this method neglects terms of order ε3/2 (and not ε2, as is the case of a standard non-resonant secular theory).
3.1 Basic equations
We consider a small body perturbed by N planets and a near MMR kp:k with a given planet p. We designate µ as the gravitational parameter of the Sun and λ and λp respectively as the mean longitudes of the small body and the planet p. The resonance widths can be computed by studying the one-degree-of-freedom simplified Hamiltonian function:
 (1)
(1)
where  are conjugate coordinates. We define the resonance centre as
  , where the central semi-major axis of the resonance is
 (2)
(2)
Here, np is the mean-motion of planet p, and εµj. is the gravitational parameter2 of planet j. The sum in Eq. (2) is made over the subset I of planets whose orbits are inside the orbit of the small body. This small corrector term accounts for the constant shift of the resonance centre due to the presence of other planets in the system (see Appendix A). The constant factor α in Eq. (1) is equal to
 (3)
(3)
If one would expand ɛW(σ) in Eq. (1) using the classical series in eccentricities and inclinations, an infinity of resonance angles featuring σ would appear, and they would verify the D’Alembert rules (see e.g. Murray & Dermott 1999). In this work, we avoid this kind of expansion and keep all these angles at once in the Hamiltonian function. This requires computing the function ɛW(σ) numerically as:
 (4)
(4)
In this expression, rj is the heliocentric position vector of planet j, and r is the heliocentric position vector of the small body evaluated at a semi-major axi a = a0. The first integral in Eq. (4) is performed over the mean longitudes λ and λj taken separately. The second integral in Eq. (4) is performed over λp only, while expressing λ as λ = (σ + kpλp)/k. Other orbital elements are taken as constants.
As stressed in Appendix A, the constant orbital elements of the planets to be used in these formulas – including the mean-motion np in Eq. (2) – are secular variables that incorporate the effects of mutual perturbations among all planets. In practice, we can take them from an existing analytical theory (see e.g. Bretagnon 1982, or Duriez & Vienne 1991 in the satellite case) or compute them from a preliminary numerical integration of the planetary system (see e.g. Lei et al. 2022). Likewise, the orbital elements (e, i, ω, Ω) of the small body must be interpreted as mean variables. Using these mean variables as fixed parameters, ɛW can be studied as a mere function of σ.
One can note that the first term in Eq. (4) does not depend on σ and is therefore constant. This is true on the resonant timescale used to define the resonance widths but not on the secular timescale, over which the orbital elements (e, i, ω, Ω) of the small body vary. The first term in Eq. (4) must therefore be kept if one wants to build upon this method to perform semi-averaged integrations of the system (see e.g. Saillenfest & Lari 2017) or develop a secular theory.
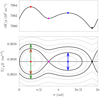 |
Fig. 1 Phase portrait of the resonance 2:3 with the Earth for a small body with e = 0.6, i = 22°, ω = 322°, and Ω = 265°. The bottom panel shows the level curves of the Hamiltonian function in Eq. (1). The central semi-major axis of the resonance is a0 = 1.31038 au (horizontal line). Coloured dots show the equilibrium points. The definition of the widths of resonance islands and sub-islands are represented by arrows. The top panel shows the behaviour of ɛW as a function of σ (i.e. this is a cut of the bottom panel along the horizontal line). |
3.2 The resonance widths
For fixed values of (e, i, ω, Ω) and of the planets’ mean orbital elements, the system has only one degree of freedom. Therefore, it is integrable, and any possible trajectory can be represented as a level curve of the Hamiltonian function in the plane (Σ, σ).
Thanks to the simple form of the Hamiltonian in Eq. (1), the fixed points can be found easily. All equilibria are located at Σ = Σ0, stable equilibria are the maxima of ɛW as a function of σ, and saddle points are its minima. As ɛW is a complex function of σ defined by integrals, its maxima and minima as a function of σ need to be found numerically (e.g. using Brent’s method; see Press et al. 2007). For substantial eccentricities and/or inclinations, many local maxima and minima can be found, resulting in a complex nested structure of the resonance island, as illustrated in Fig. 1. This picture strongly differs from the low-eccentricity, low-inclination paradigm (see e.g. Murray & Dermott 1999) for which a single cosine term dominates the dynamics with a single critical argument for the resonance.
Once the maxima and minima of ɛW have been found numerically, the Hamiltonian function in Eq. (1) directly gives the widths of all islands and sub-islands of the resonance. In particular, the outermost separatrix determines the overall width of the kp:k resonance. If we write ɛWmax, the global maximum of ɛW, as a function of σ and ɛWmin, its global minimum (red and black dots in Fig. 1), the overall half-width of the resonance is
 (5)
(5)
which is illustrated by the green arrow in Fig. 1. In terms of the semi-major axis α, the corresponding upper and lower boundaries of the resonance are  . The same formula can be applied on the local minima and maxima of ɛW in order to compute the widths of the sub-islands of resonance.
Figures 2–4 show the widths of the islands and sub-islands of resonance as a function of eccentricity for different commensu-rabilities kp:k with the Earth and Jupiter. These diagrams reveal various bifurcations where a sub-island shrinks and vanishes, leading to the disappearance of an inner separatrix. Similar diagrams have been described by Gallardo (2019) and Namouni & Morais (2020) in the Solar System, by Gallardo et al. (2021) in the non-restricted two-planet case, and by Malhotra & Zhang (2020), Malhotra & Chen (2023) in the planar case using a non-perturbative approach.
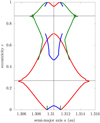 |
Fig. 2 Width of all resonance islands and sub-islands as a function of eccentricity for the 2:3 commensurability with the Earth. The small body has i = 22°, ω = 322°, and Ω = 265°, similar to the Geminids (see Courtot et al. 2023). Horizontal lines show the locations where the orbit of the small body crosses the orbit of the resonant planet. See Fig. 1 for an illustration of the different islands at e = 0.6. |
4 Results
All maps are drawn as a function of initial orbital elements and final OFLI. We only present maps drawn in function of an initial semi-major axis and initial eccentricity or in function of an initial semi-major axis and initial mean anomaly. These orbital elements are representative of the short-term dynamics of the particles (see e.g. Appendix A); hence, they directly reflect the level of short-term chaoticity that we are looking for in this article. We use the names ‘mean anomaly map’ and ‘eccentricity map’ to describe the two maps for ease of reference even though they are also drawn as a function of initial semi-major axis and final OFLI.
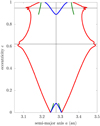 |
Fig. 3 Same as Fig. 2 but for the 2:1 commensurability with Jupiter. The small body has i = 30°, ω = 171°, and Ω. = 198°, similar to the Draconids (see Table 1). |
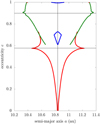 |
Fig. 4 Same as Fig. 2 but for the 1:3 commensurability with Jupiter. The small body has i = 167°, ω = 228°, and Ω = 170°, similar to the Leonids (see Table 2). |
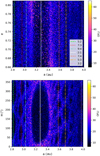 |
Fig. 5 Eccentricity and mean anomaly maps drawn from the dataset Draconids BIN10100 after the 1000 years of integration. The lines represent the resonances we identified (see text). |
4.1 Draconids
4.1.1 Mean-motion resonances and close encounters
Maps from the BIN 10100 set are presented in the Fig. 5. In this subsection, the NGFs are negligible because they do not play a role for such large particles (see also Courtot et al. 2023). We identified seven resonances with Jupiter in the mean anomaly map (see Table 3). Only the largest (2:1) is undoubtedly visible in the eccentricity map. The resonances are easily identified thanks to the number of lobes, which reveals the value of the denominator. For the largest resonance in particular, the separatrix around the resonance is characterised by highly chaotic trajectories (bright pink dots; high values of OFLI). It is indeed well known that chaos first appears at the separatrix in Hamiltonian dynamics (Poincaré 1890).
One may be tempted to relate the large width of the 2:1 resonance to its low ‘order’ (which is traditionally defined as 2-1 = 1). However, strictly speaking, this definition of the resonance order is only valid in the low-eccentricity, low-inclination paradigm. Both the Draconids and Leonids have very large eccentricities and inclinations, so the traditional notion of resonance order loses its meaning and should be redefined (see e.g. Morais & Namouni 2013; Namouni & Morais 2017; Morais & Giuppone 2012). Therefore, we avoid using this notion and instead focus on the width of the MMRs as visible in the maps or as computed semi-analytically.
The least visible resonance is the 9:4 resonance, perhaps because of its closeness to the largest resonance as well as the fact that the resonance is very thin itself. All resonances identified in this work were already detected in previous works, such as Fernández et al. (2014).
Even though we detected close encounters with Mercury (three particles), Venus (1031), Earth (1445), Mars (106), Saturn (19), Uranus (two), and Neptune (one), by far the most encounters happened with Jupiter (30 397 particles). For this reason, as well as the interplay with the MMRs, our analysis below focuses only on close encounters with Jupiter.
Figure 6 presents maps for BIN10100 once again, but this time only particles that encountered Jupiter during the integration are plotted. The mean anomaly map clearly shows the effect of the MMRs combined with the close encounters: particles trapped inside the MMRs do not meet with Jupiter. Only the leftmost and rightmost MMRs (5:2 and 3:2) do not present such obvious features. There seems to be fewer close encounters in general for these semi-major axes, which means the effect of the capture is less visible.
As for the eccentricity map, as before, the only resonance undoubtedly visible is the 2:1 resonance, but there are encounters with Jupiter even inside this resonance. This is in fact the effect of the separatrix, as the only encounters inside the resonance are linked with an initial mean anomaly close to 0° [2π], where the separatrix lays. To verify this assumption, we drew another eccentricity map in Fig. 7 based on particles that meet Jupiter, but the colour bar represents the value of the initial mean anomaly instead of the OFLI.
We were also able to verify that the position of the separatrix is linked with the initial position of Jupiter, in mean longitude. For initial conditions taken a few years earlier or later, the resonance islands on the mean anomaly maps appear shifted vertically.
Mean-motion resonances with Jupiter found in the Draconids maps.
4.1.2 Effect of non-gravitational forces
In order to investigate the effect of NGFs, we studied the datasets with smaller radii. We drew maps from BIN110 and BIN011 but found no notable difference from the previous maps. We had to use the dataset BIN00101 to visualise the effect of NGFs, and only the mean anomaly map revealed it (see Fig. 8). The lobes are all fuzzier, especially for the 5:2, 7:3, and 9:4 MMRs. The main lobe (2:1 MMR) is also slightly distorted, losing its symmetry, and more chaos is visible on the right side of the separatrix than on its left side (compare with Fig. 5). The NGFs make the particles diffuse towards a smaller semi-major axis, which means that particles initially on the left side of the separatrix can leave this chaotic zone thanks to the NGFs and reach zones where encounters with Jupiter will be less chaotic. On the other hand, particles on the right side of the separatrix are blocked from diffusing to the left because of the separatrix itself. Particles trapped on this right side of the separatrix will experience more chaos and more chaotic encounters with Jupiter.
These differences are much subtler than what we could have expected from our previous work on the Geminids, where the map from BIN011 revealed the destruction of the resonances involved because of the NGFs (Courtot et al. 2023). However, two parameters might play a role in this difference: the type of orbit and the width of the resonances.
According to Liou & Zook (1997), only the Poynting-Robertson drag could be responsible for the escape of the particles from the MMRs, if it happens. Geminids are characterised by a smaller perihelion distance, a smaller semi-major axis and thus a greater velocity than the Draconids. Therefore, we can expect a highly different effect of the Poynting-Robertson drag, namely, it will probably be too weak to make the small Draconids diffuse out of the MMR.
Liou & Zook (1997) showed that the drift rate in the semi-major axis due to this force can be written:
 (6)
(6)
with β as the ratio of the radiation pressure force and the Sun gravitational force, μ⊙ as the gravitational constant of the Sun, and c as the speed of light. We also have (Burns et al. 1979):
 (7)
(7)
with ρ as the density of the particle, r as its radius, and S0 as the solar flux at R0 = 1 au; its value is S0 = 1.37 kW m-2 (Cox 2000). We chose a radius of 0.3 mm, which corresponds to the largest radius at which a Geminid particle can escape the MMR through diffusion from Poynting-Robertson (Courtot et al. 2023).
We applied this equation to the Geminids (a = 1.275 au, e = 0.875), and we obtained −1.53 × 10⁻¹²au s-1, and for the Draconids (a = 3.4 au, e = 0.735), we obtained −1.75 × 10⁻¹³au s-1. This would mean that over 1000 years, the drift in the semi-major axis due to Poynting-Robertson would be of −0.048 au for the Geminids and of −0.006 au for the Draconids.
Furthermore, the widest MMR for the Geminids is 2:3 with the Earth, which is much thinner than the widest MMR for the Draconids. We computed the width of both of these MMRs using the method described in Sect. 3. We used typical values of the orbital elements of both meteoroid streams as parameters (see Figs. 2 and 3). Figure 9 shows the comparison we obtained. For the range in eccentricity considered, the maximum width for the Geminds main MMR is 6.54 × 10⁻³ au, compared to 0.37 au for the Draconids main MMR.
In summary, not only is the Poynting-Robertson drag more efficient for the Geminids, but more importantly, the width of the MMR that can trap Geminid particles is much smaller than the width of the MMR that can trap Draconids. This explains why, even at a low radius, Draconids tend to stay captured in the MMR, which contrasts with what we observed with the Geminids.
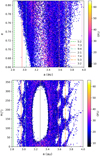 |
Fig. 6 Same as Fig. 5 but only showing particles that encountered Jupiter during the integration. The white area shows the initial phase space that does not lead to a close encounter with Jupiter. |
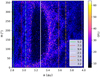 |
Fig. 8 Mean anomaly map from the dataset Draconids BIN00101. |
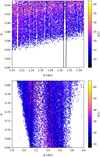 |
Fig. 9 Width of the MMR for the Geminids (2:3 with the Earth; top) and for the Draconids (2:1 with Jupiter; bottom). The first map is adapted from Courtot et al. (2023); we only added the newly computed width of the MMR on a map presented therein (radius between 10 and 100 mm, integration during 1000 years, all particles plotted encountered the Earth). In the second case, we added the eccentricity map from BIN10100 with only particles that meet with Jupiter. The resonance is between the two dark lines. |
4.2 Leonids
4.2.1 Mean-motion resonances and close encounters
As with the Draconids, we first drew maps from the BIN10100 dataset. In the Fig. 10, an MMR with Jupiter is detected: the 1:3 at 10.83681 au. This MMR is visible in both eccentricity and mean anomaly maps, with the three lobes present in the latter.
A similar mechanism to the one presented for the Draconids takes place, where the majority of close encounters with Jupiter occur for particles either outside the MMR or on the separatrix. This is proven in Fig. 11 by drawing maps from particles that underwent at least one close encounter with Jupiter during the integration. The eccentricity map shows there are fewer encounters with Jupiter at high eccentricity, even outside the MMR, and inside the MMR, there are more encounters for lower eccentricities.
In contrast to the Draconids, there are some close encounters with Jupiter for particles inside the lobes. Those particles either come from the separatrix region or have a relatively lower initial eccentricity (≲0.87), as can be seen in Fig. 12.
Amongst particles that do encounter Jupiter from inside the lobes, with a relatively small initial eccentricity, most met with Saturn during the integration before meeting Jupiter. It seems those close encounters shifted their orbits enough to get them out of the lobes and were therefore able to meet with Jupiter.
Close encounters with Saturn are shown in Fig. 13, where we drew our maps from particles that had a close encounter with Saturn. As expected, the eccentricity map reveals that most close encounters with Saturn happen for particles with initially relatively low eccentricity, as these particles only need minimal orbital variations to reach an orbit-crossing configuration.
The mean anomaly map, on the other hand, shows some interesting characteristics: lines unlike any other features seen so far. We were able to confirm that each line is created as time passes, when the orbits shift enough to create a new line (see the legend of Fig. 13). In other words, these lines represent the evolving relation between semi-major axis and mean anomaly necessary to encounter Saturn.
We also studied close encounters with the planets from the inner solar system in Fig. 14. Those encounters happen mostly above a limit in mean anomaly, which depends on the planet considered, and is linear as a function of semi-major axis. These lines are very visible inside the MMR but get disturbed outside of it, most probably by close encounters with Jupiter.
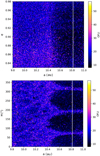 |
Fig. 10 Eccentricity and mean anomaly maps from the dataset Leonids BIN10100 after the 2000 years of integration. The white line represents the position of the 1:3 MMR with Jupiter. |
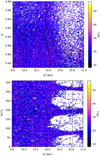 |
Fig. 11 Eccentricity and mean anomaly maps from the dataset BIN10100. We only plot the particles that met with Jupiter at least once during the 2000 years of integration. On the eccentricity map, we plot the width of the MMR (1:3 with Jupiter). The resonance is too wide for our set of initial conditions. The black line represents the limit of the MMR on its left side (see Fig. 4 for the full resonance width). |
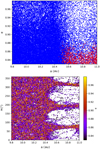 |
Fig. 12 Map in mean anomaly and in eccentricity from the BIN10100 dataset. We only plot the particles that encountered Jupiter. The eccentricity map presents two colours: red for particles from inside the lobes and blue for the rest. The colour bar from the mean anomaly map gives the value of the eccentricity. |
4.2.2 Effect of non-gravitational forces
As with the Draconids, we had to use the dataset with the smallest particles (BIN00101) in order to investigate the impact of the NGFs. Even then, the only visible difference in Fig. 15 is a bar of particles with high chaoticity at an initial mean anomaly around 0°. In the same figure, we also drew a map from BIN00101 with only the particles that met with Jupiter during the integration. This second map shows the bar clearly comes from close encounters with Jupiter. A combination of the initial position of Jupiter and the effect of NGFs, which are particularly strong at the perihelion, are probably the origin of this new bar.
Once again, we expected the weaker Poynting-Robertson drag to be responsible for the difference in the dynamics of the Geminids and Leonids at such small radii. We applied the same Eq. (6) to the Leonids (using a = 10.4 au and e = 0.905), and we obtained a velocity of drift in the semi-major axis of −2.86 × 10⁻¹³au s−1, which would translate to a drift of −0.009 au over 1000 years. These values are very similar to those previously obtained for the Draconids.
We also compared the width of the 1:3 MMR with Jupiter which plays a role for the Leonids with that of the 2:3 MMR with the Earth, which has an influence on the Geminids. Using representative values of the orbital elements (see Fig. 4), we obtained the eccentricity map of Fig. 11, where the computed width of the MMR fits well with the detected MMR (for comparison of widths, see Fig. 9.). The maximum width for the Leonids is 1.03 au in the considered range of eccentricity, which is much greater than 6.54 × 10⁻³ au for the Geminids. Once again, the combination of a weaker NGF and a larger MMR means that the dynamics of small particles is very similar to the behaviour of large particles.
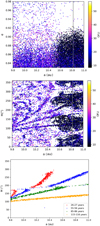 |
Fig. 13 Eccentricity and mean anomaly maps from the BIN10100 dataset. We only plot the particles that encountered Saturn. On the right-hand side of the mean anomaly map, the lobes are visible, while in the left-hand side, several lines appear. The last figure shows the time at which those lines appeared. Encounters outside the lines happened after 116 years of integration. |
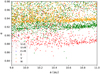 |
Fig. 14 Map in eccentricity from the dataset BIN10100. We plot the particles that met with Venus (orange), the Earth (green), or Mars (red). We also plot the particles that met both Venus and the Earth (light blue), both Venus and Mars (brown), as well as both the Earth and Mars (dark blue), although these three cases are not as common as the first three. The OFLI (not visible here) reaches values similar to the general map, with its maximum being only slightly smaller. |
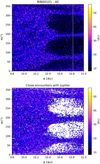 |
Fig. 15 Maps in semi-major axis and mean anomaly from the dataset BIN00101. One map includes all the particles, while the other only shows the particles that underwent a close encounter with Jupiter. |
5 Conclusion
Amongst the meteor showers listed by the IAU, several are contested. The tools available today are not always able to discriminate between actual meteor showers and groups of meteors seemingly coming from similar orbits. In order to contribute to this discussion, we studied the influence of chaos on meteoroid streams. We drew chaos maps on well-known meteoroid streams that give rise to uncontested meteor showers. In future works, we will compare those maps to others drawn from disputed meteor showers. For this purpose, we need to study different types of meteoroid streams.
After our first study of chaos on the Geminid meteoroid stream, which allowed us to test our method while also yielding interesting results, we tackled the JFC Draconid and the HTC Leonid meteoroid streams in this work. Both their aphelia and perihelia are much greater than the previously studied Geminids, and we therefore expected different dynamics and a different relationship to chaos compared to the Geminids.
For both streams, we proved that Jupiter is an important driver of their dynamics. Saturn also plays an important role in the Leonids stream. We detected several MMRs with Jupiter and highlighted the phenomenon of particles being captured inside the MMR, which prevents the particles from meeting Jupiter. In the specific case of the Leonids, we showed how close encounters with Saturn inside the Jupiter MMR could sometimes lead to the escape of the particles.
We also studied the effect of NGFs and noted that this effect is much weaker for the Draconids and Leonids than for the Geminids. In order to explain this, we analysed both the width of the MMRs detected as well as the strength of the NGFs. We showed that the MMRs involved in the Draconids and the Leonids dynamics are much wider than the MMRs detected for the Geminids. We also showed that the NGFs are much stronger for the Geminids than for the Draconids or Leonids, due to the shapes of their orbits.
The semi-analytical method presented in Sect. 3 revealed its full utility when applied to orbits as inclined and eccentric as those of the Draconids and Leonids. The detailed structure of MMRs, including their overall widths, can be computed from a few numerical methods. The agreement between the chaos maps and the semi-analytical results is very encouraging because it shows that the semi-analytical approach can be used in future works to not only characterise resonances but to also study the dynamical evolution of individual meteoroids, as NGFs make them transition through the inner and outer separatrices of the resonances (either as resonance captures or escapes, as small particles gradually leak out of resonance).
From these results, we conclude that for the streams studied here, the main differences (if any) in the dynamical behaviour between large (>10 cm) and small (<100 µm) meteoroids mainly comes from their initial ejection velocity from the parent body, but this is not related to chaos. All of this has been proven thanks to chaos maps. Maps drawn from other colours are available by request. In the future, we will dive deeper into the relationship between chaoticity and meteor showers whose existence might be questionable.
Acknowledgements
Ariane Courtot acknowledges support from the École Doctorale d’Astronomie et d’Astrophysique d’Île-de-France (ED 127).
Appendix A Computation of the semi-averaged resonant Hamiltonian function
In Section 3, we compute the widths of MMRs by a semi-analytical approach valid for arbitrary eccentricities and inclinations. Here in the appendix, we detail the methodology used to average the Hamiltonian function and express it in a form that naturally leads to the adiabatic approximation.
A.1 Hamiltonian function in osculating coordinates
Using the notations of Sect. 3, the Hamiltonian function describing the instantaneous dynamics of a small body perturbed by N planets can be written as ℋ = ℋ0 + εℋ1 with
 (A.1)
(A.1)
The variable Λj is the momentum conjugate to the mean longitude λj of planet j. Using these notations, µ and µj have the same order of magnitude, while ε ≪ 1 is used to materialise the small size of the perturbation. The vector rj depends on both λj and time t through the varying orbital elements of planet j.
The heliocentric Keplerian elements of the small body are written (a, e, i, w, ω,Ω, M), with the associated canonical Delaunay elements:
 (A.2)
(A.2)
We considered a MMR kp:k between the small body and a given planet with index j = p, where kp and k are co-prime integers. At the vicinity of the resonance, the combination σ = kλ − kpλp varies slowly, where λ = ℓ + g + h. The combination σ is taken as a new canonical coordinate by a linear unimodular transformation (Milani & Baccili 1998). We used the following choice of coordinates:
 (A.3)
(A.3)
which led to the new momenta
 (A.4)
(A.4)
In this expression, c and cp are integers chosen such that ckp − cpk = 1; they always exist as gcd(k, kp) = 1.
This specific choice for the variable σ emphasises that we do not presuppose any particular form for the resonance angle and keep all resonant terms with combination kp:k in the Hamiltonian function. If we assumed that the small body is close to or inside a resonance with combination kp:k, then the new coordinates γ and {λj≠p} are fast angles (orbital timescale; frequency ∝ ε0); σ is a semi-slow angle (resonant timescale; frequency ∝ ε1/2); and (u, υ) are slow angles (secular timescale; frequency ∝ ε1; see Sect. A.4 below).
A.2 The semi-secular system
We defined the semi-secular Hamiltonian function 𝒦 by removing the fast angles from the Hamiltonian ℋ in Eq. (A.1) using a close-to-identity change of coordinates. Therefore, in the semi-secular coordinates (that we write with the same symbols for simplicity), the Hamiltonian function does not depend on γ and {λj≠p}. As a consequence, the momenta Γ and {Λj≠p} are constants of motion that have arbitrary values. We conveniently chose them to be equal to zero such that our coordinates are simply
 (A.5)
(A.5)
Dropping constant terms, the semi-secular Hamiltonian function is defined as
 (A.6)
(A.6)
where
 (A.7)
(A.7)
For the planets with index j ≠ p, the indirect part vanishes over the average, so we omitted it in Eq. (A.7). Apart from λj, the orbital elements of planet j are slowly varying coordinates that we keep constant while computing the integrals. We computed the integrals numerically so that all resonant terms are included, and our approach is valid for all eccentricities and inclinations. When averaged, the orbital elements and mean-motions of the planets used in Eq. (A.7) become secular variables that incorporate the effects of mutual perturbations among planets.
A.3 Expansion around the resonance centre
Near the kp:k resonance with planet p, the conjugate pair (Σ, σ) evolves with characteristic the frequency of order ε1/2, while the secular precession of the orbits takes place with the frequency of order ε. Hence, if ε is small enough, these two timescales are well separated, and we can use the same averaging method as in Sect. A.2 to remove the angle σ from the Hamiltonian function. However, the two characteristic frequencies are only separated by a factor ε1/2, so the neglected terms are of the order ε3/2 (and not ε2 as in Eq. A.6).
In practice, this method consists of first studying the evolution of (Σ, σ) for fixed values of (U, V, u, υ) and the planets’ mean orbital elements. It is called the 'adiabatic approximation’ and was popularised notably by Wisdom (1985) and Henrard (1982, 1993). Here, we only need to compute the resonance widths, which amounts to numerically finding the separatrices of the resonance in the (Σ, σ) plane.
In order to find the resonance separatrices, it is convenient to first expand the Hamiltonian function at the vicinity of the resonance centre3. In the restricted three-body problem, we usually estimate the resonance centre Σ0 from the Hamiltonian 𝒦0 taken alone. However, in a multi-planetary system as considered here, there can be a constant shift between this value and the one obtained by considering the whole Hamiltonian. This constant shift is due to the zeroth-order term of the development of 𝒦1 in Legendre polynomials. It can be taken into account by redefining the splitting of the Hamiltonian:
 (A.8)
(A.8)
where the additional term is the zeroth-order term in the Legendre development of 𝒦1 that we transfer to 𝒦0 (and thus remove from 𝒦1). Here, the summation is only realised over the subset  of planets inner to the small body since the outer planets have no zeroth-order dependence on the semi-major axis a (see e.g. Laskar & Boué 2010). As defined from
  taken alone, the nominal semi-major axis at the centre of the resonance is
 (A.9)
(A.9)
From Eq. (A.5), Σ0 is equivalent to a semi-major axis a0 as expressed in Eq. (2) of the main text. If we set ε = 0, we retrieve the classical estimate of the resonance centre. We now expand the Hamiltonian function around Σ0:
 (A.10)
Considering that the small body is close to or inside the resonance, the distance |Σ − Σ0| is of the order of the resonance width4, which goes as ε1/2 (this well-known property can be verified a posteriori; see Eq. 5 of the main text). As we neglect terms of order ε3/2 when using the adiabatic approximation, it is unnecessary to keep them at this point. Therefore, omitting constant parts, we obtain
 (A.11)
where α = O(1) is a positive constant expressed in Eq. (3) of the main text, and
 (A.12)
The Hamiltonian function in Eq. (A.11) is given in a slightly different form in Eqs. (1) and (4) of the main text.
A.4 The adiabatic approximation
Writing down Hamilton’s equations of motion and using the variable  instead of Σ, we get
 (A.13)
As pointed out by Sidorenko (2006), the pair (Φ, σ) may be used as conjugate coordinates if we divide the variables (U, V, u, υ) by ε1/4. In Eq. (A.13), the difference of timescale between the three degrees of freedom clearly appears: (Φ, σ) are semi-slow (time-derivatives of order  ), whereas (U, V, u, υ) are slow (time derivatives of order ε). This leads to the adiabatic approximation, that is, solving for the semi-slow degree of freedom (Φ, σ) while fixing the slow ones (U, u) and (V, υ).
In practice, the coordinates U and V defined in Eq. (A.5) can be replaced by equivalent variables ē and ī as
 (A.14)
For a small body oscillating inside the resonance, ē and ī can be directly interpreted as the mean eccentricity and inclination of the small body over one libration cycle. For simplicity, we dropped the ‘bar’ symbol in the main text and identified ē and ī as ē and ī.
As  is evaluated at a = a0 in the definition of W (see Eq. A.12), we can now perform the required integrals in Eq. (A.7) using the standard Keplerian elements (a0, e, i, ω, Ω) and forget about the canonical coordinates (U, V, u, υ) taken as constants. The Hamiltonian function in Eq. (A.11) can then be used to compute the characteristics of the kp:k MMR, in particular, its widths, as described in Sect. 3 of the main text.
References
- Beust, H. 2016, A&A, 590, L2 [NASA ADS] [CrossRef] [EDP Sciences] [Google Scholar]
- Beust, H., & Morbidelli, A. 1996, Icarus, 120, 358 [NASA ADS] [CrossRef] [Google Scholar]
- Bretagnon, P. 1982, A&A, 114, 278 [NASA ADS] [Google Scholar]
- Burns, J. A., Lamy, P. L., & Soter, S. 1979, Icarus, 40, 1 [Google Scholar]
- Courtot, A., Vaubaillon, J., & Fouchard, M. 2023, A&A, 673, A161 [NASA ADS] [CrossRef] [EDP Sciences] [Google Scholar]
- Cox, A. N. 2000, Allen’s Astrophysical Quantities, 4th edn. (New York: AIP Press; Springer) [Google Scholar]
- Duriez, L., & Vienne, A. 1991, A&A, 243, 263 [NASA ADS] [Google Scholar]
- Efimov, S. S., & Sidorenko, V. V. 2020, Celest. Mech. Dyn. Astron., 132, 27 [NASA ADS] [CrossRef] [Google Scholar]
- Egal, A., Wiegert, P., Brown, P. G., et al. 2019, Icarus, 330, 123 [NASA ADS] [CrossRef] [Google Scholar]
- Everhart, E. 1985, An Efficient Integrator that Uses Gauss-Radau Spacings, 115, eds. A. Carusi, & G. B. Valsecchi, 185 [NASA ADS] [Google Scholar]
- Fernández, J. A., Sosa, A., Gallardo, T., & Gutiérrez, J. N. 2014, Icarus, 238, 1 [CrossRef] [Google Scholar]
- Fienga, A., Laskar, J., Morley, T., et al. 2009, A&A, 507, 1675 [NASA ADS] [CrossRef] [EDP Sciences] [Google Scholar]
- Fouchard, M., Lega, E., Froeschlé, C., & Froeschlé, C. 2002, Celest. Mech. Dyn. Astron., 83, 205 [NASA ADS] [CrossRef] [Google Scholar]
- Gallardo, T. 2006a, Icarus, 184, 29 [Google Scholar]
- Gallardo, T. 2006b, Icarus, 181, 205 [NASA ADS] [CrossRef] [Google Scholar]
- Gallardo, T. 2019, Icarus, 317, 121 [NASA ADS] [CrossRef] [Google Scholar]
- Gallardo, T. 2020, Celest. Mech. Dyn. Astron., 132, 9 [Google Scholar]
- Gallardo, T., Hugo, G., & Pais, P. 2012, Icarus, 220, 392 [NASA ADS] [CrossRef] [Google Scholar]
- Gallardo, T., Beaugé, C., & Giuppone, C. A. 2021, A&A, 646, A148 [NASA ADS] [CrossRef] [EDP Sciences] [Google Scholar]
- Gartrell, G., & Elford, W. G. 1975, Aust. J. Phys., 28, 591 [NASA ADS] [CrossRef] [Google Scholar]
- Gomes, R. S., Gallardo, T., Fernández, J. A., & Brunini, A. 2005, Celest. Mech. Dyn. Astron., 91, 109 [NASA ADS] [CrossRef] [Google Scholar]
- Henrard, J. 1982, in NATO Advanced Study Institute (ASI) Series C, 82, Applications of Modern Dynamics to Celestial Mechanics and Astrodynamics, ed. V. Szebehely, 153 [NASA ADS] [Google Scholar]
- Henrard, J. 1993, The Adiabatic Invariant in Classical Mechanics, in Dynamics Reported, Expositions in Dynamical Systems, 2 (Springer Berlin Heidelberg) [Google Scholar]
- Henrard, J., & Lemaitre, A. 1983, Celest. Mech., 30, 197 [Google Scholar]
- Jenniskens, P. 2008, Icarus, 194, 13 [NASA ADS] [CrossRef] [Google Scholar]
- Jenniskens, P., & Vaubaillon, J. 2008, Earth Moon Planets, 102, 157 [NASA ADS] [CrossRef] [Google Scholar]
- Jopek, T. J., Hajduková, M., Rudawska, R., et al. 2023, New Astron. Rev., 96, 101671 [NASA ADS] [CrossRef] [Google Scholar]
- Laskar, J., & Boué, G. 2010, A&A, 522, A60 [NASA ADS] [CrossRef] [EDP Sciences] [Google Scholar]
- Laskar, J., & Robutel, P. 1995, Celest. Mech. Dyn. Astron., 62, 193 [Google Scholar]
- Lei, H. 2019, MNRAS, 487, 2097 [CrossRef] [Google Scholar]
- Lei, H., Li, J., Huang, X., & Li, M. 2022, AJ, 164, 74 [NASA ADS] [CrossRef] [Google Scholar]
- Lenard, A. 1959, Ann. Phys., 6, 261 [NASA ADS] [CrossRef] [Google Scholar]
- Liou, J.-C., & Zook, H. A. 1997, Icarus, 128, 354 [NASA ADS] [CrossRef] [Google Scholar]
- Lyytinen, E., & Jenniskens, P. 2003, Icarus, 162, 443 [NASA ADS] [CrossRef] [Google Scholar]
- Malhotra, R., & Chen, Z. 2023, MNRAS, 521, 1253 [CrossRef] [Google Scholar]
- Malhotra, R., & Zhang, N. 2020, MNRAS, 496, 3152 [NASA ADS] [CrossRef] [Google Scholar]
- McNaught, R. H., & Asher, D. J. 1999, WGN, J. Int. Meteor Organ., 27, 85 [Google Scholar]
- Milani, A., & Baccili, S. 1998, Celest. Mech. Dyn. Astron., 71, 35 [NASA ADS] [CrossRef] [Google Scholar]
- Morais, M. H. M., & Giuppone, C. A. 2012, MNRAS, 424, 52 [Google Scholar]
- Morais, M. H. M., & Namouni, F. 2013, Celest. Mech. Dyn. Astron., 117, 405 [NASA ADS] [CrossRef] [Google Scholar]
- Murray, C. D., & Dermott, S. F. 1999, Solar System Dynamics (Cambridge University Press) [Google Scholar]
- Namouni, F., & Morais, M. H. M. 2017, MNRAS, 471, 2097 [NASA ADS] [CrossRef] [Google Scholar]
- Namouni, F., & Morais, M. H. M. 2020, MNRAS, 493, 2854 [NASA ADS] [CrossRef] [Google Scholar]
- Neslušan, L., & Hajduková, M. 2017, A&A, 598, A40 [NASA ADS] [CrossRef] [EDP Sciences] [Google Scholar]
- Pichierri, G., Morbidelli, A., & Lai, D. 2017, A&A, 605, A23 [NASA ADS] [CrossRef] [EDP Sciences] [Google Scholar]
- Poincaré, H. 1890, Acta Math., 13, 1 [Google Scholar]
- Press, W. H., Teukolsky, S. A., Vetterling, W. T., & Flannery, B. P. 2007, Numerical Recipes: The Art of Scientific Computing, third edition (Cambridge University Press) [Google Scholar]
- Ryabova, G. O., Avdyushev, V. A., & Williams, I. P. 2019, MNRAS, 485, 3378 [NASA ADS] [CrossRef] [Google Scholar]
- Saillenfest, M. 2020, Celest. Mech. Dyn. Astron., 132, 12 [Google Scholar]
- Saillenfest, M., & Lari, G. 2017, A&A, 603, A79 [NASA ADS] [CrossRef] [EDP Sciences] [Google Scholar]
- Saillenfest, M., Fouchard, M., Tommei, G., & Valsecchi, G. 2016, Celest. Mech. Dyn. Astron., 126, 369 [NASA ADS] [CrossRef] [Google Scholar]
- Sidorenko, V. V. 2006, Cosmic Res., 44, 440 [NASA ADS] [CrossRef] [Google Scholar]
- Vaubaillon, J., & Jenniskens, P. 2007, Adv. Space Res., 39, 612 [NASA ADS] [CrossRef] [Google Scholar]
- Vaubaillon, J., Colas, F., & Jorda, L. 2005, A&A, 439, 751 [NASA ADS] [CrossRef] [EDP Sciences] [Google Scholar]
- Vaubaillon, J., Watanabe, J., Sato, M., Horii, S., & Koten, P. 2011, WGN, J. Int. Meteor Organ., 39, 59 [NASA ADS] [Google Scholar]
- Vaubaillon, J., Neslušan, L., Sekhar, A., Rudawska, R., & Ryabova, G. O. 2019, in Meteoroids: Sources of Meteors on Earth and Beyond, eds. G. O. Ryabova, D. J. Asher, & M. J. Campbell-Brown, 161 [Google Scholar]
- Williams, I. P., & Wu, Z. 1993, MNRAS, 262, 231 [NASA ADS] [Google Scholar]
- Williams, I. P., Jopek, T. J., Rudawska, R., Tóth, J., & Kornoš, L. 2019, in Meteoroids: Sources of Meteors on Earth and Beyond, eds. G. O. Ryabova, D. J. Asher, & M. J. Campbell-Brown, 210 [Google Scholar]
- Wisdom, J. 1985, Icarus, 63, 272 [Google Scholar]
- Wu, Z., & Williams, I. P. 1996, MNRAS, 280, 1210 [CrossRef] [Google Scholar]
https://www.ta3.sk/IAUC22DB/MDC2022/Roje/roje_lista.php accessed in April 2023.
The factor ε has no explicit definition; it is only used here to highlight the smallness of ɛµj· with respect to µ.
This step is not compulsory; one can also directly study the Hamiltonian function 𝒦 in Eq. (A.7) in the two-dimensional plane spanned by (Σ, σ), as done by Saillenfest et al. (2016) and Lei et al. (2022). However, this introduces an unnecessary complexity in the numerical algorithm.
This behaviour of the resonance width is not true for near-zero eccen tricities in first-order resonances. The shift of the resonance centre and opening of the separatrices when e → 0 (see e.g. Henrard & Lemaitre 1983; Murray & Dermott 1999; Malhotra & Zhang 2020; Malhotra & Chen 2023) are therefore not captured in the model presented here.
All Tables
All Figures
|
Fig. 1 Phase portrait of the resonance 2:3 with the Earth for a small body with e = 0.6, i = 22°, ω = 322°, and Ω = 265°. The bottom panel shows the level curves of the Hamiltonian function in Eq. (1). The central semi-major axis of the resonance is a0 = 1.31038 au (horizontal line). Coloured dots show the equilibrium points. The definition of the widths of resonance islands and sub-islands are represented by arrows. The top panel shows the behaviour of ɛW as a function of σ (i.e. this is a cut of the bottom panel along the horizontal line). |
| In the text | |
|
Fig. 2 Width of all resonance islands and sub-islands as a function of eccentricity for the 2:3 commensurability with the Earth. The small body has i = 22°, ω = 322°, and Ω = 265°, similar to the Geminids (see Courtot et al. 2023). Horizontal lines show the locations where the orbit of the small body crosses the orbit of the resonant planet. See Fig. 1 for an illustration of the different islands at e = 0.6. |
| In the text | |
|
Fig. 3 Same as Fig. 2 but for the 2:1 commensurability with Jupiter. The small body has i = 30°, ω = 171°, and Ω. = 198°, similar to the Draconids (see Table 1). |
| In the text | |
|
Fig. 4 Same as Fig. 2 but for the 1:3 commensurability with Jupiter. The small body has i = 167°, ω = 228°, and Ω = 170°, similar to the Leonids (see Table 2). |
| In the text | |
|
Fig. 5 Eccentricity and mean anomaly maps drawn from the dataset Draconids BIN10100 after the 1000 years of integration. The lines represent the resonances we identified (see text). |
| In the text | |
|
Fig. 6 Same as Fig. 5 but only showing particles that encountered Jupiter during the integration. The white area shows the initial phase space that does not lead to a close encounter with Jupiter. |
| In the text | |
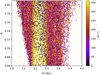 |
Fig. 7 Same as Fig. 6 except that the colour scale shows the initial mean anomaly for each particle. |
| In the text | |
|
Fig. 8 Mean anomaly map from the dataset Draconids BIN00101. |
| In the text | |
|
Fig. 9 Width of the MMR for the Geminids (2:3 with the Earth; top) and for the Draconids (2:1 with Jupiter; bottom). The first map is adapted from Courtot et al. (2023); we only added the newly computed width of the MMR on a map presented therein (radius between 10 and 100 mm, integration during 1000 years, all particles plotted encountered the Earth). In the second case, we added the eccentricity map from BIN10100 with only particles that meet with Jupiter. The resonance is between the two dark lines. |
| In the text | |
|
Fig. 10 Eccentricity and mean anomaly maps from the dataset Leonids BIN10100 after the 2000 years of integration. The white line represents the position of the 1:3 MMR with Jupiter. |
| In the text | |
|
Fig. 11 Eccentricity and mean anomaly maps from the dataset BIN10100. We only plot the particles that met with Jupiter at least once during the 2000 years of integration. On the eccentricity map, we plot the width of the MMR (1:3 with Jupiter). The resonance is too wide for our set of initial conditions. The black line represents the limit of the MMR on its left side (see Fig. 4 for the full resonance width). |
| In the text | |
|
Fig. 12 Map in mean anomaly and in eccentricity from the BIN10100 dataset. We only plot the particles that encountered Jupiter. The eccentricity map presents two colours: red for particles from inside the lobes and blue for the rest. The colour bar from the mean anomaly map gives the value of the eccentricity. |
| In the text | |
|
Fig. 13 Eccentricity and mean anomaly maps from the BIN10100 dataset. We only plot the particles that encountered Saturn. On the right-hand side of the mean anomaly map, the lobes are visible, while in the left-hand side, several lines appear. The last figure shows the time at which those lines appeared. Encounters outside the lines happened after 116 years of integration. |
| In the text | |
|
Fig. 14 Map in eccentricity from the dataset BIN10100. We plot the particles that met with Venus (orange), the Earth (green), or Mars (red). We also plot the particles that met both Venus and the Earth (light blue), both Venus and Mars (brown), as well as both the Earth and Mars (dark blue), although these three cases are not as common as the first three. The OFLI (not visible here) reaches values similar to the general map, with its maximum being only slightly smaller. |
| In the text | |
|
Fig. 15 Maps in semi-major axis and mean anomaly from the dataset BIN00101. One map includes all the particles, while the other only shows the particles that underwent a close encounter with Jupiter. |
| In the text | |
Current usage metrics show cumulative count of Article Views (full-text article views including HTML views, PDF and ePub downloads, according to the available data) and Abstracts Views on Vision4Press platform.
Data correspond to usage on the plateform after 2015. The current usage metrics is available 48-96 hours after online publication and is updated daily on week days.
Initial download of the metrics may take a while.