Fig. 1
Download original image
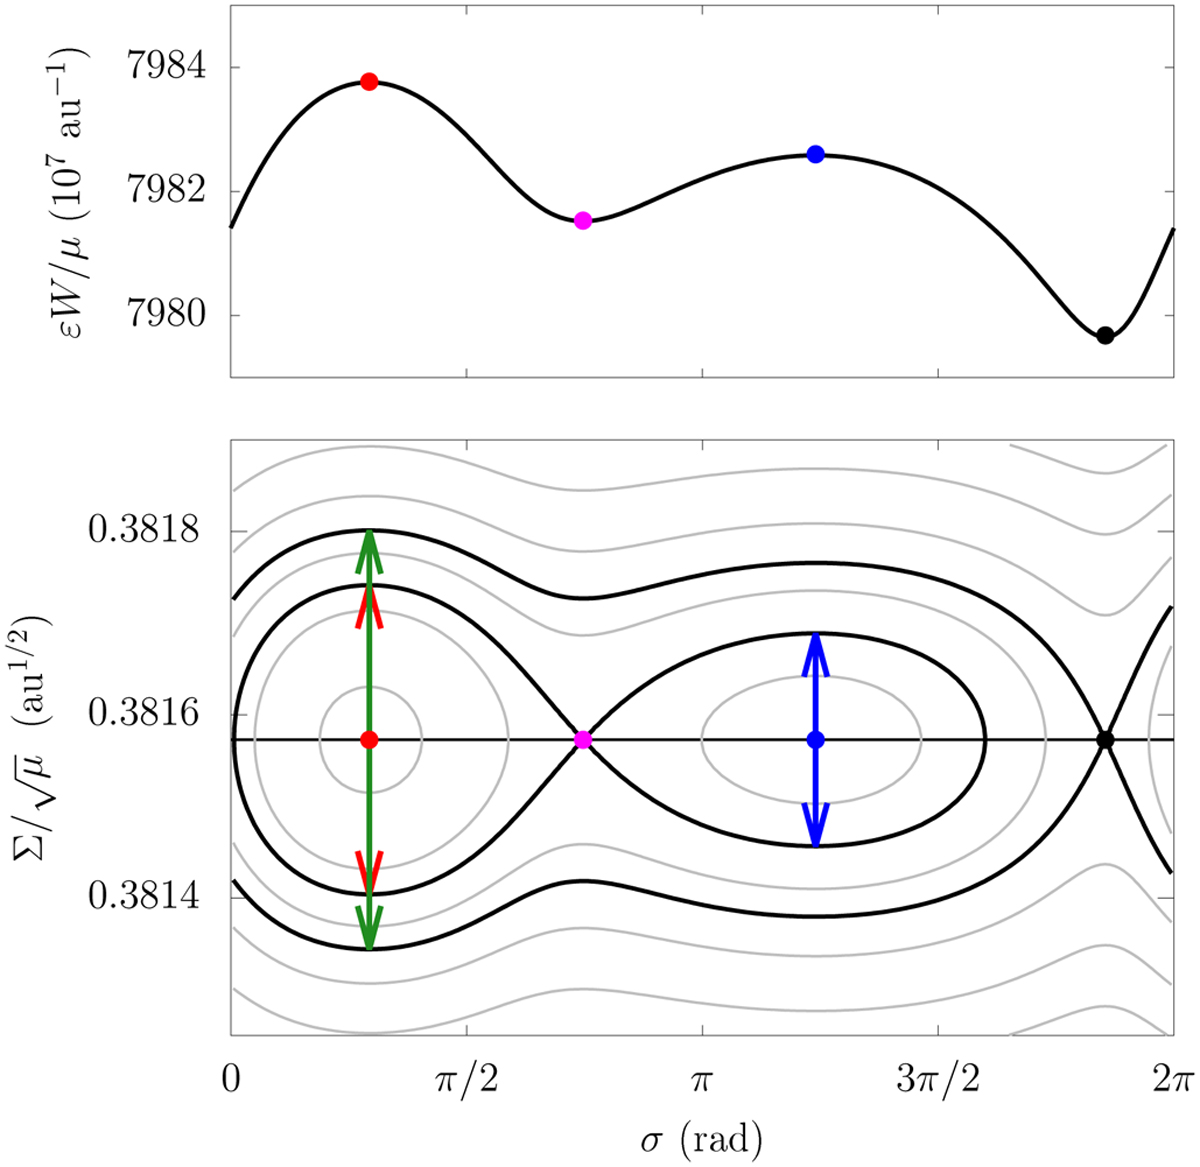
Phase portrait of the resonance 2:3 with the Earth for a small body with e = 0.6, i = 22°, ω = 322°, and Ω = 265°. The bottom panel shows the level curves of the Hamiltonian function in Eq. (1). The central semi-major axis of the resonance is a0 = 1.31038 au (horizontal line). Coloured dots show the equilibrium points. The definition of the widths of resonance islands and sub-islands are represented by arrows. The top panel shows the behaviour of ɛW as a function of σ (i.e. this is a cut of the bottom panel along the horizontal line).
Current usage metrics show cumulative count of Article Views (full-text article views including HTML views, PDF and ePub downloads, according to the available data) and Abstracts Views on Vision4Press platform.
Data correspond to usage on the plateform after 2015. The current usage metrics is available 48-96 hours after online publication and is updated daily on week days.
Initial download of the metrics may take a while.