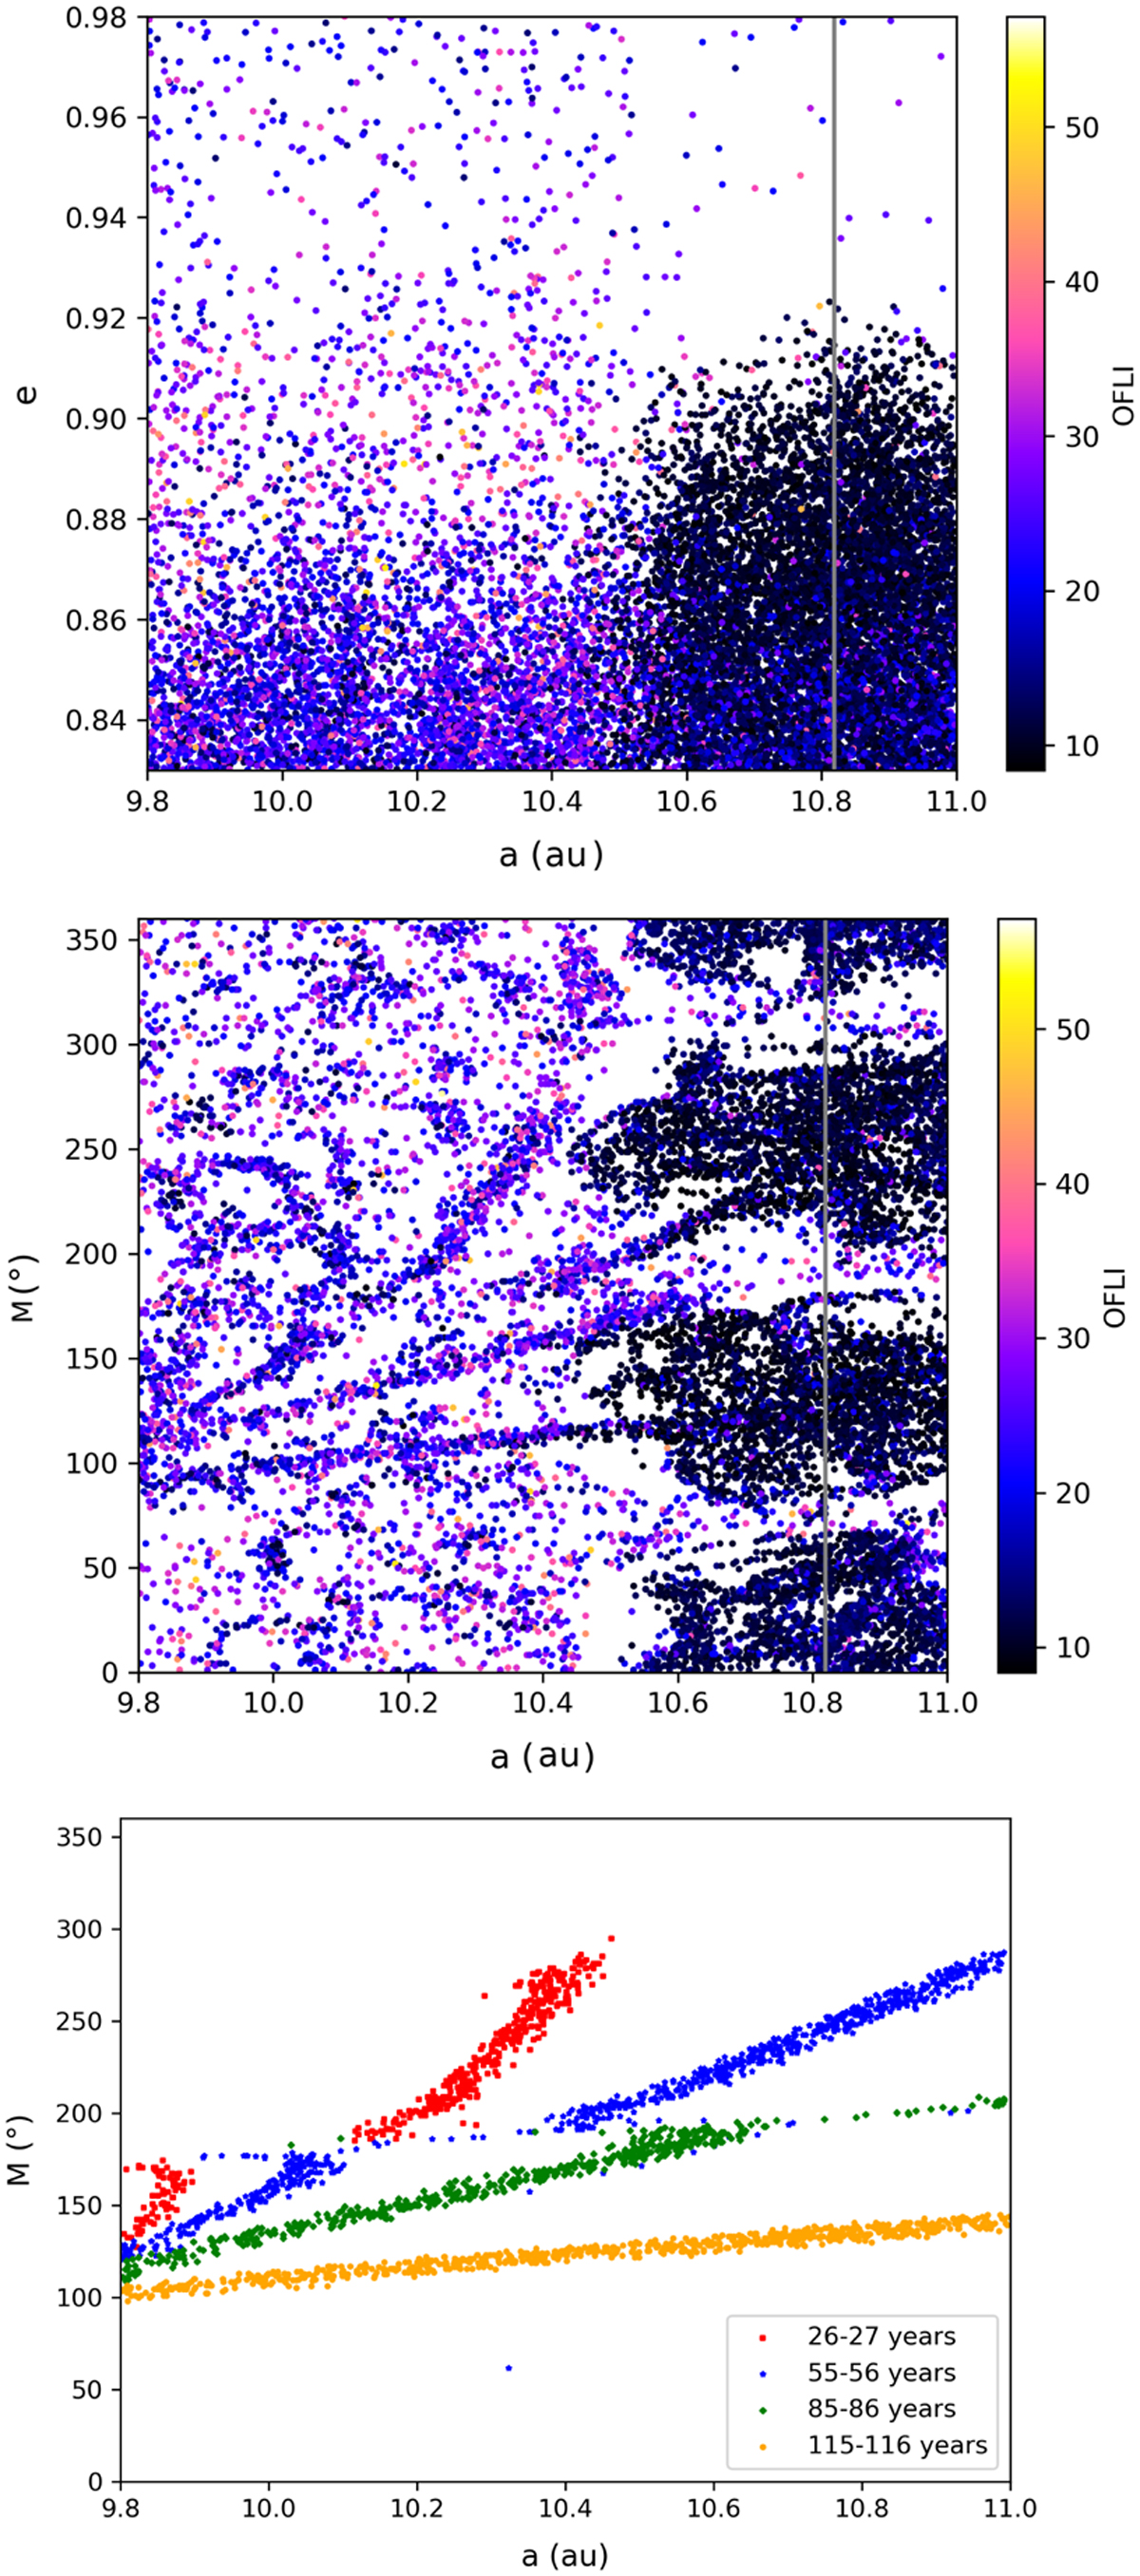
Fig. 13
Download original image
Eccentricity and mean anomaly maps from the BIN10100 dataset. We only plot the particles that encountered Saturn. On the right-hand side of the mean anomaly map, the lobes are visible, while in the left-hand side, several lines appear. The last figure shows the time at which those lines appeared. Encounters outside the lines happened after 116 years of integration.
Current usage metrics show cumulative count of Article Views (full-text article views including HTML views, PDF and ePub downloads, according to the available data) and Abstracts Views on Vision4Press platform.
Data correspond to usage on the plateform after 2015. The current usage metrics is available 48-96 hours after online publication and is updated daily on week days.
Initial download of the metrics may take a while.