Open Access
Fig. 12
Download original image
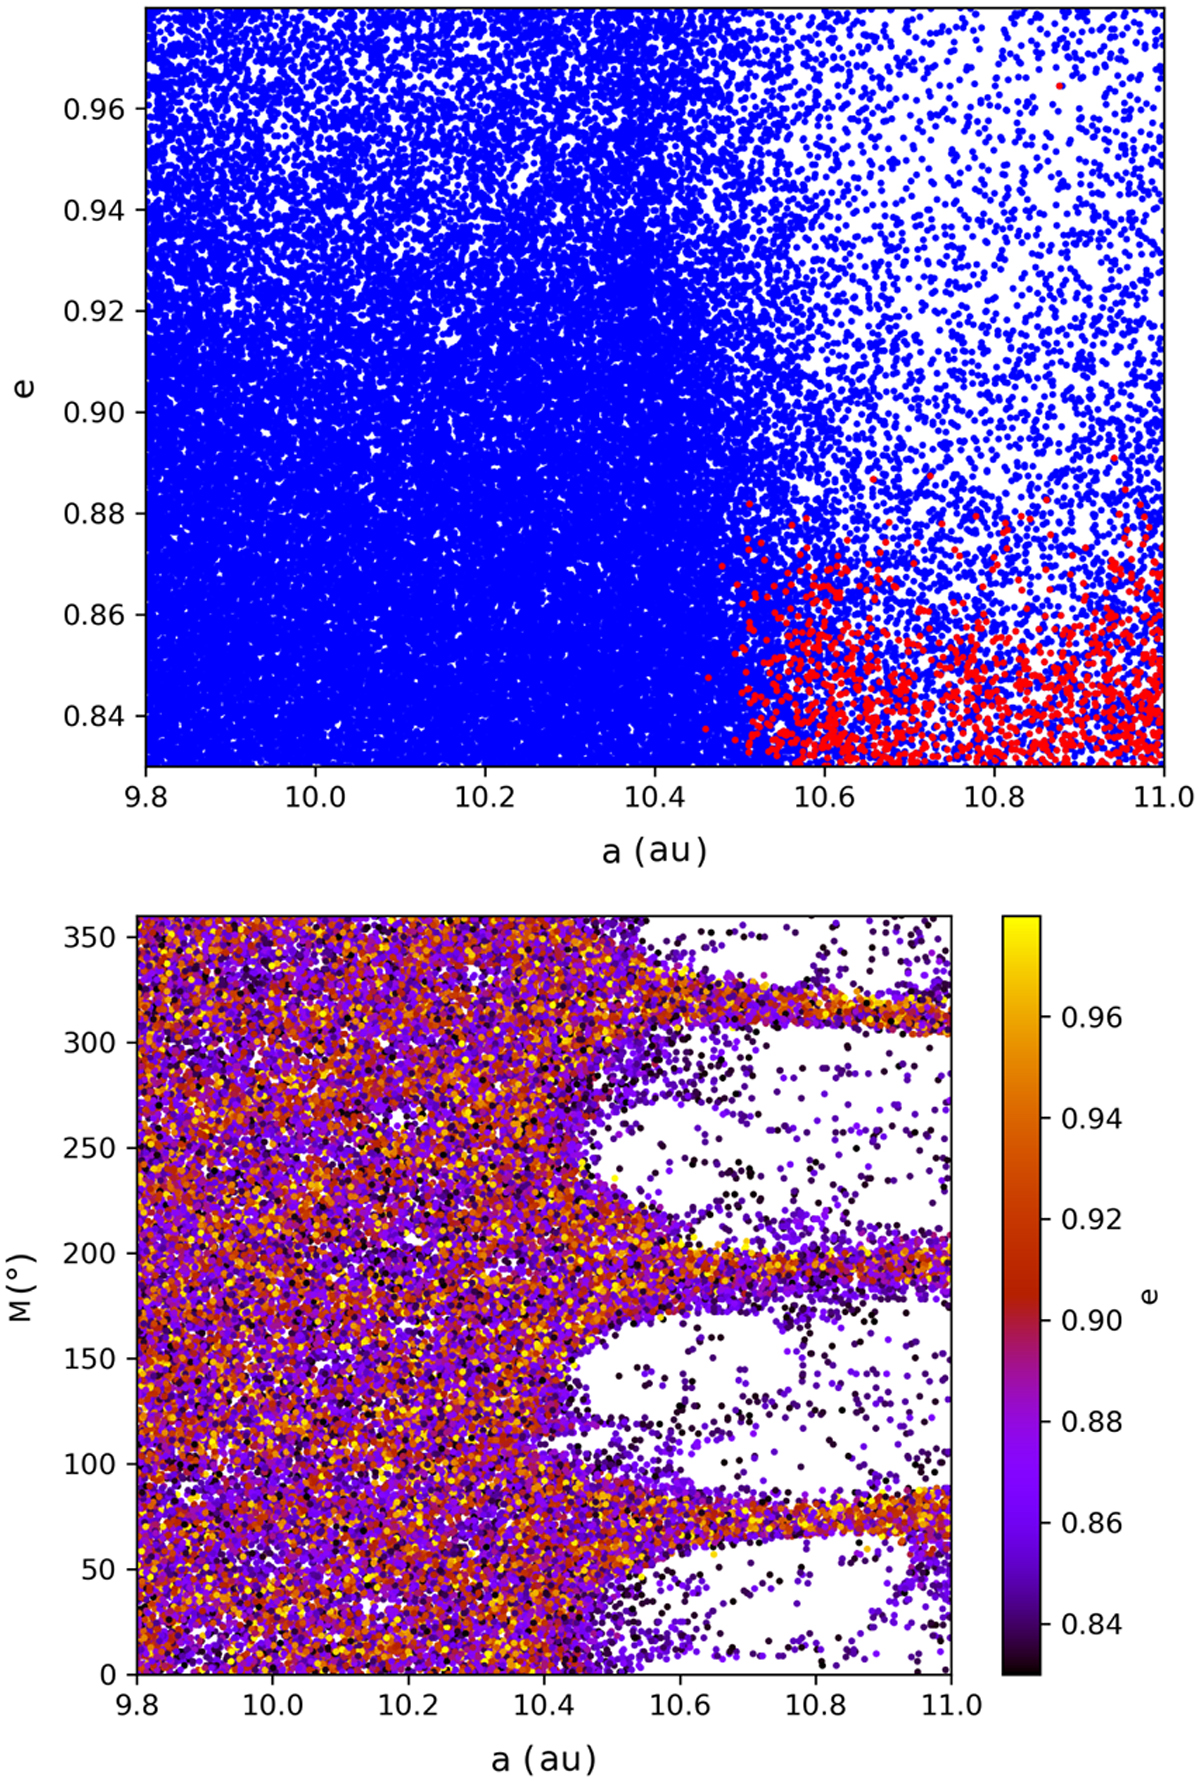
Map in mean anomaly and in eccentricity from the BIN10100 dataset. We only plot the particles that encountered Jupiter. The eccentricity map presents two colours: red for particles from inside the lobes and blue for the rest. The colour bar from the mean anomaly map gives the value of the eccentricity.
Current usage metrics show cumulative count of Article Views (full-text article views including HTML views, PDF and ePub downloads, according to the available data) and Abstracts Views on Vision4Press platform.
Data correspond to usage on the plateform after 2015. The current usage metrics is available 48-96 hours after online publication and is updated daily on week days.
Initial download of the metrics may take a while.