Fig. 11
Download original image
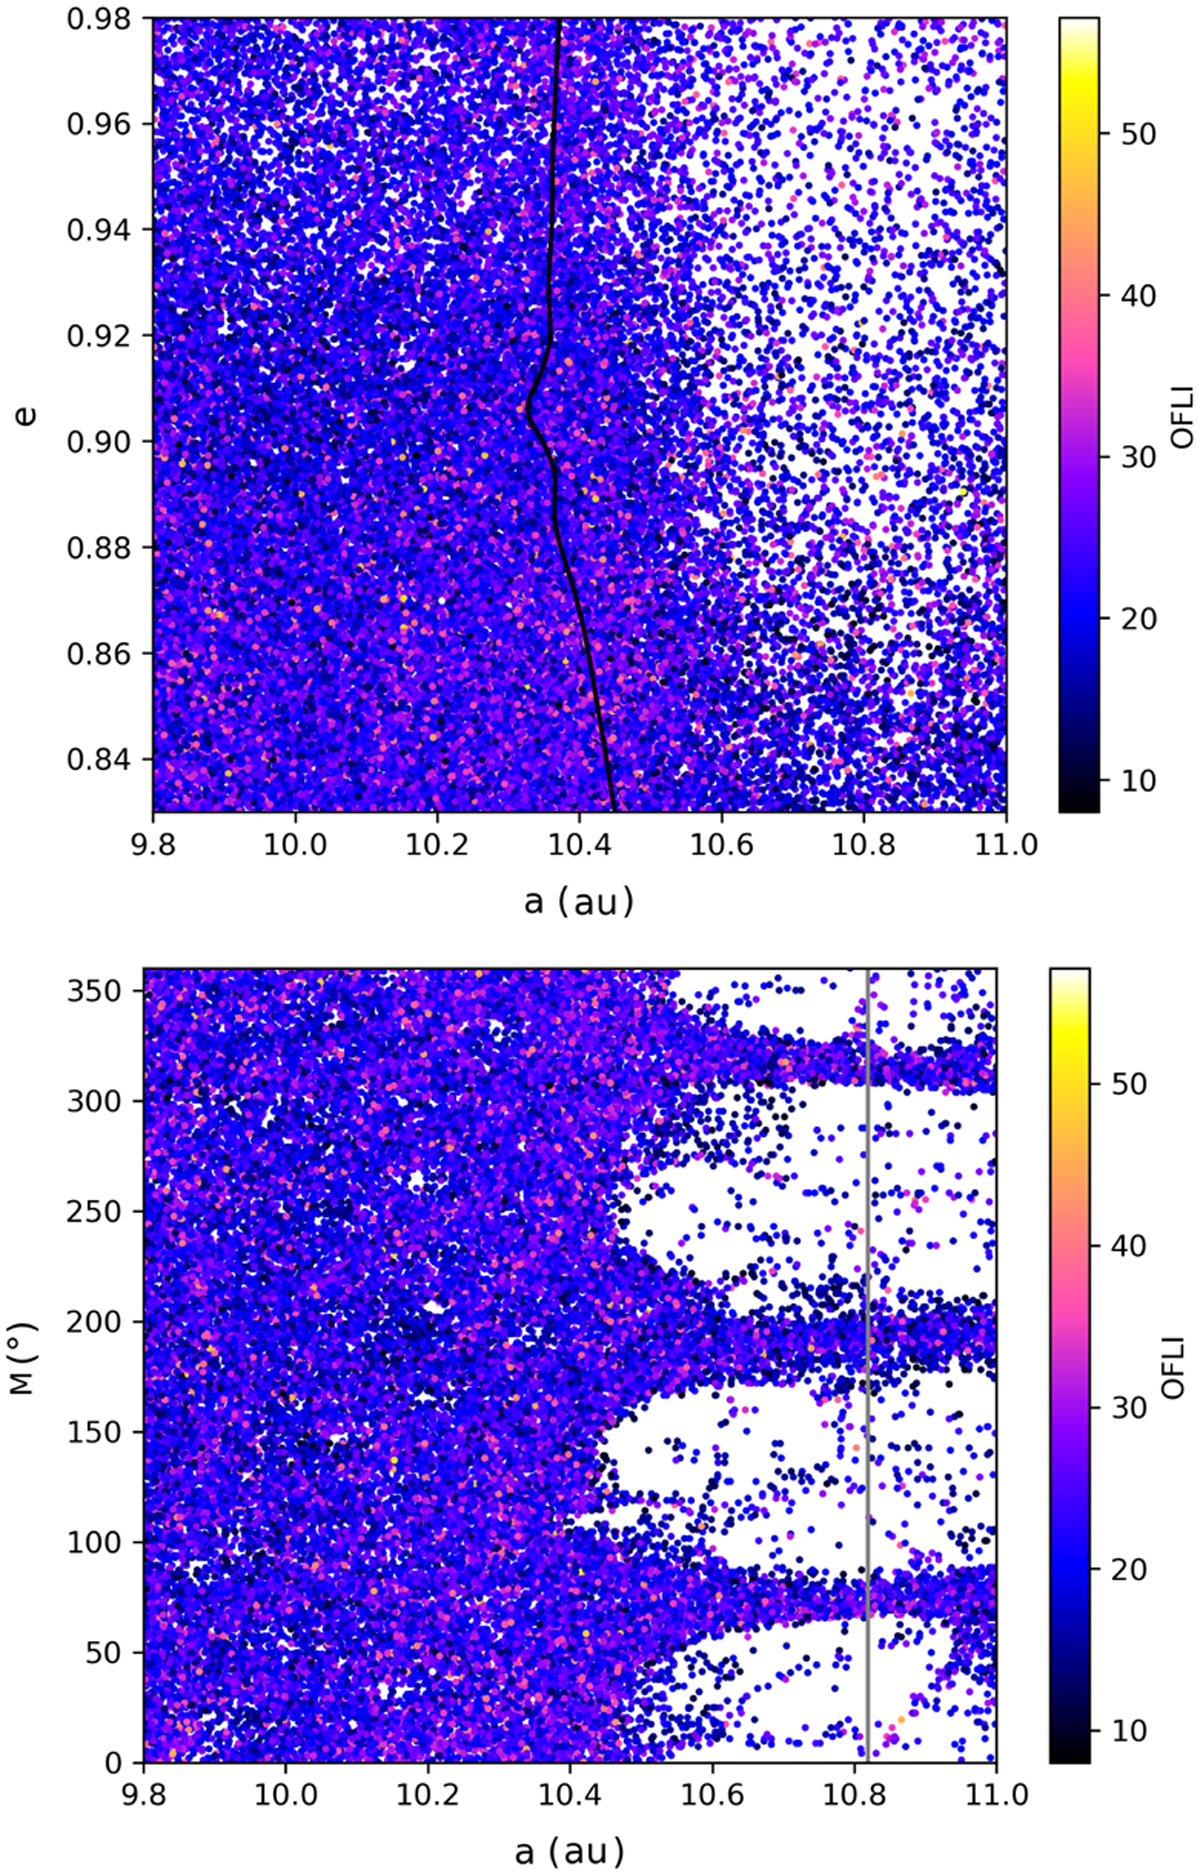
Eccentricity and mean anomaly maps from the dataset BIN10100. We only plot the particles that met with Jupiter at least once during the 2000 years of integration. On the eccentricity map, we plot the width of the MMR (1:3 with Jupiter). The resonance is too wide for our set of initial conditions. The black line represents the limit of the MMR on its left side (see Fig. 4 for the full resonance width).
Current usage metrics show cumulative count of Article Views (full-text article views including HTML views, PDF and ePub downloads, according to the available data) and Abstracts Views on Vision4Press platform.
Data correspond to usage on the plateform after 2015. The current usage metrics is available 48-96 hours after online publication and is updated daily on week days.
Initial download of the metrics may take a while.