Open Access
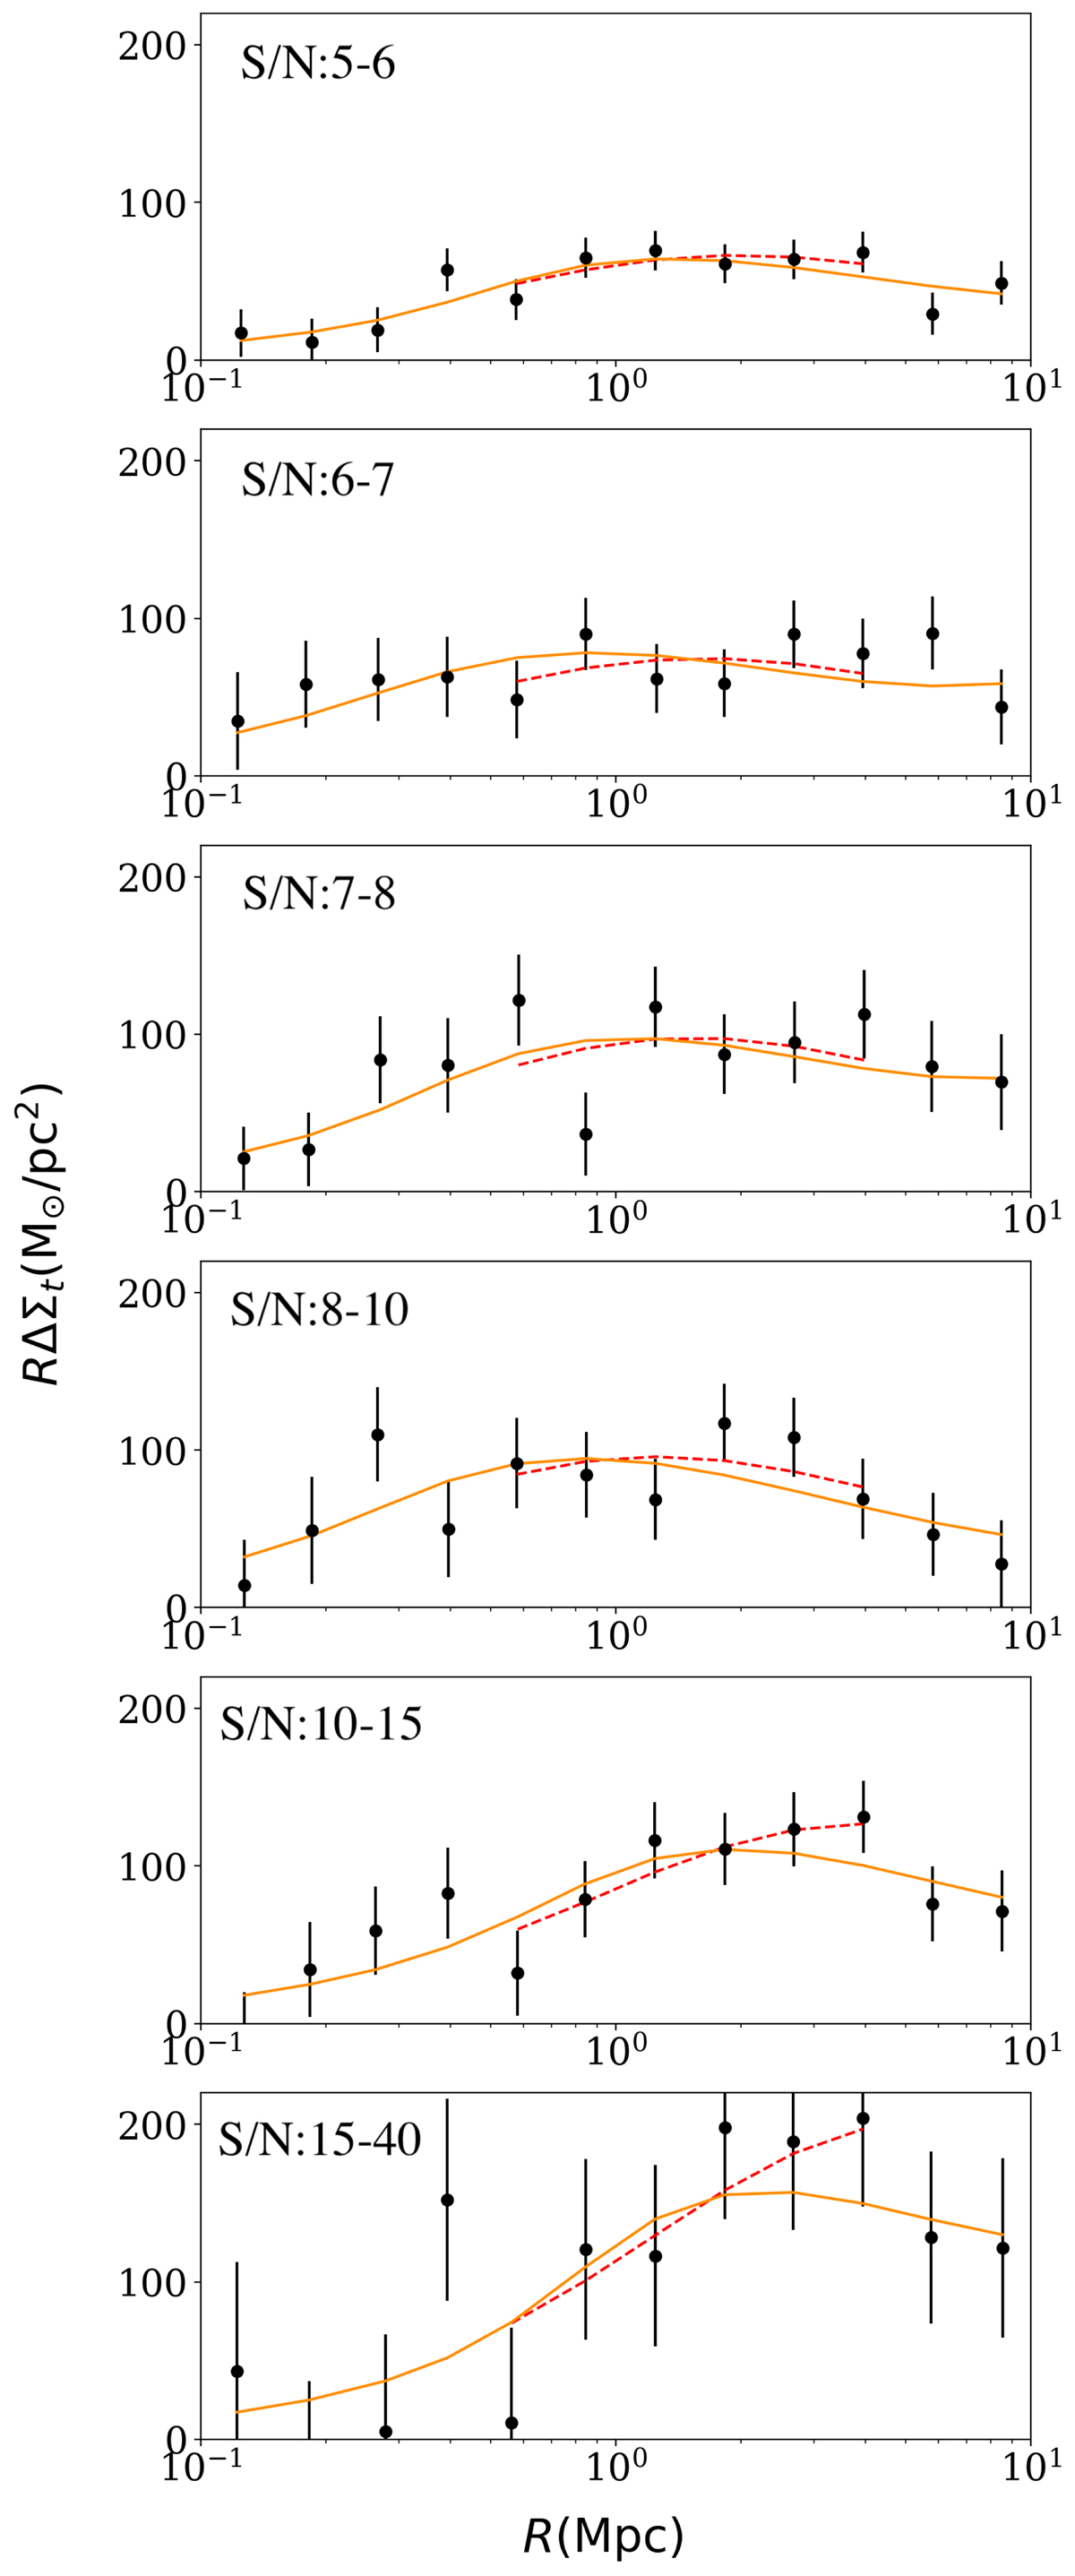
Fig. 5.
Download original image
ESD profile (ΔΣ) as a function of radius R, for each sub-sample of clusters. The best fit lines are also plotted shown in red for the single NFW and orange for the halo model.
Current usage metrics show cumulative count of Article Views (full-text article views including HTML views, PDF and ePub downloads, according to the available data) and Abstracts Views on Vision4Press platform.
Data correspond to usage on the plateform after 2015. The current usage metrics is available 48-96 hours after online publication and is updated daily on week days.
Initial download of the metrics may take a while.