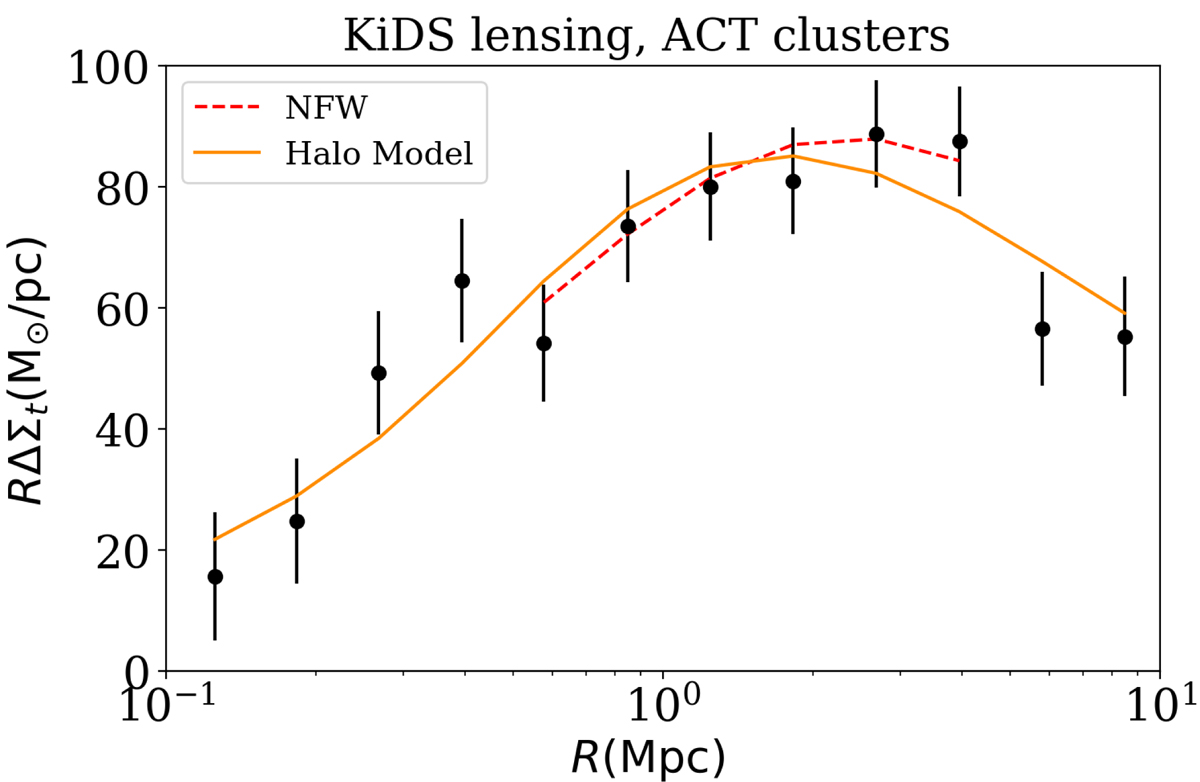
Fig. 3.
Download original image
ESD profile (ΔΣ) multiplied by the radius R as a function of radius R for the complete stack of 157 SZ-detected clusters. The signal is detected at 25σ significance. The best-fitting model is shown using a single NFW, shown in red, and the halo model, shown in orange. A limited range of scales is used for the NFW model to avoid the impact of mis-centring at small scales and the contribution from large-scale structure at scales greater than 5 Mpc. Both models give good fits to the data.
Current usage metrics show cumulative count of Article Views (full-text article views including HTML views, PDF and ePub downloads, according to the available data) and Abstracts Views on Vision4Press platform.
Data correspond to usage on the plateform after 2015. The current usage metrics is available 48-96 hours after online publication and is updated daily on week days.
Initial download of the metrics may take a while.