Fig. 2.
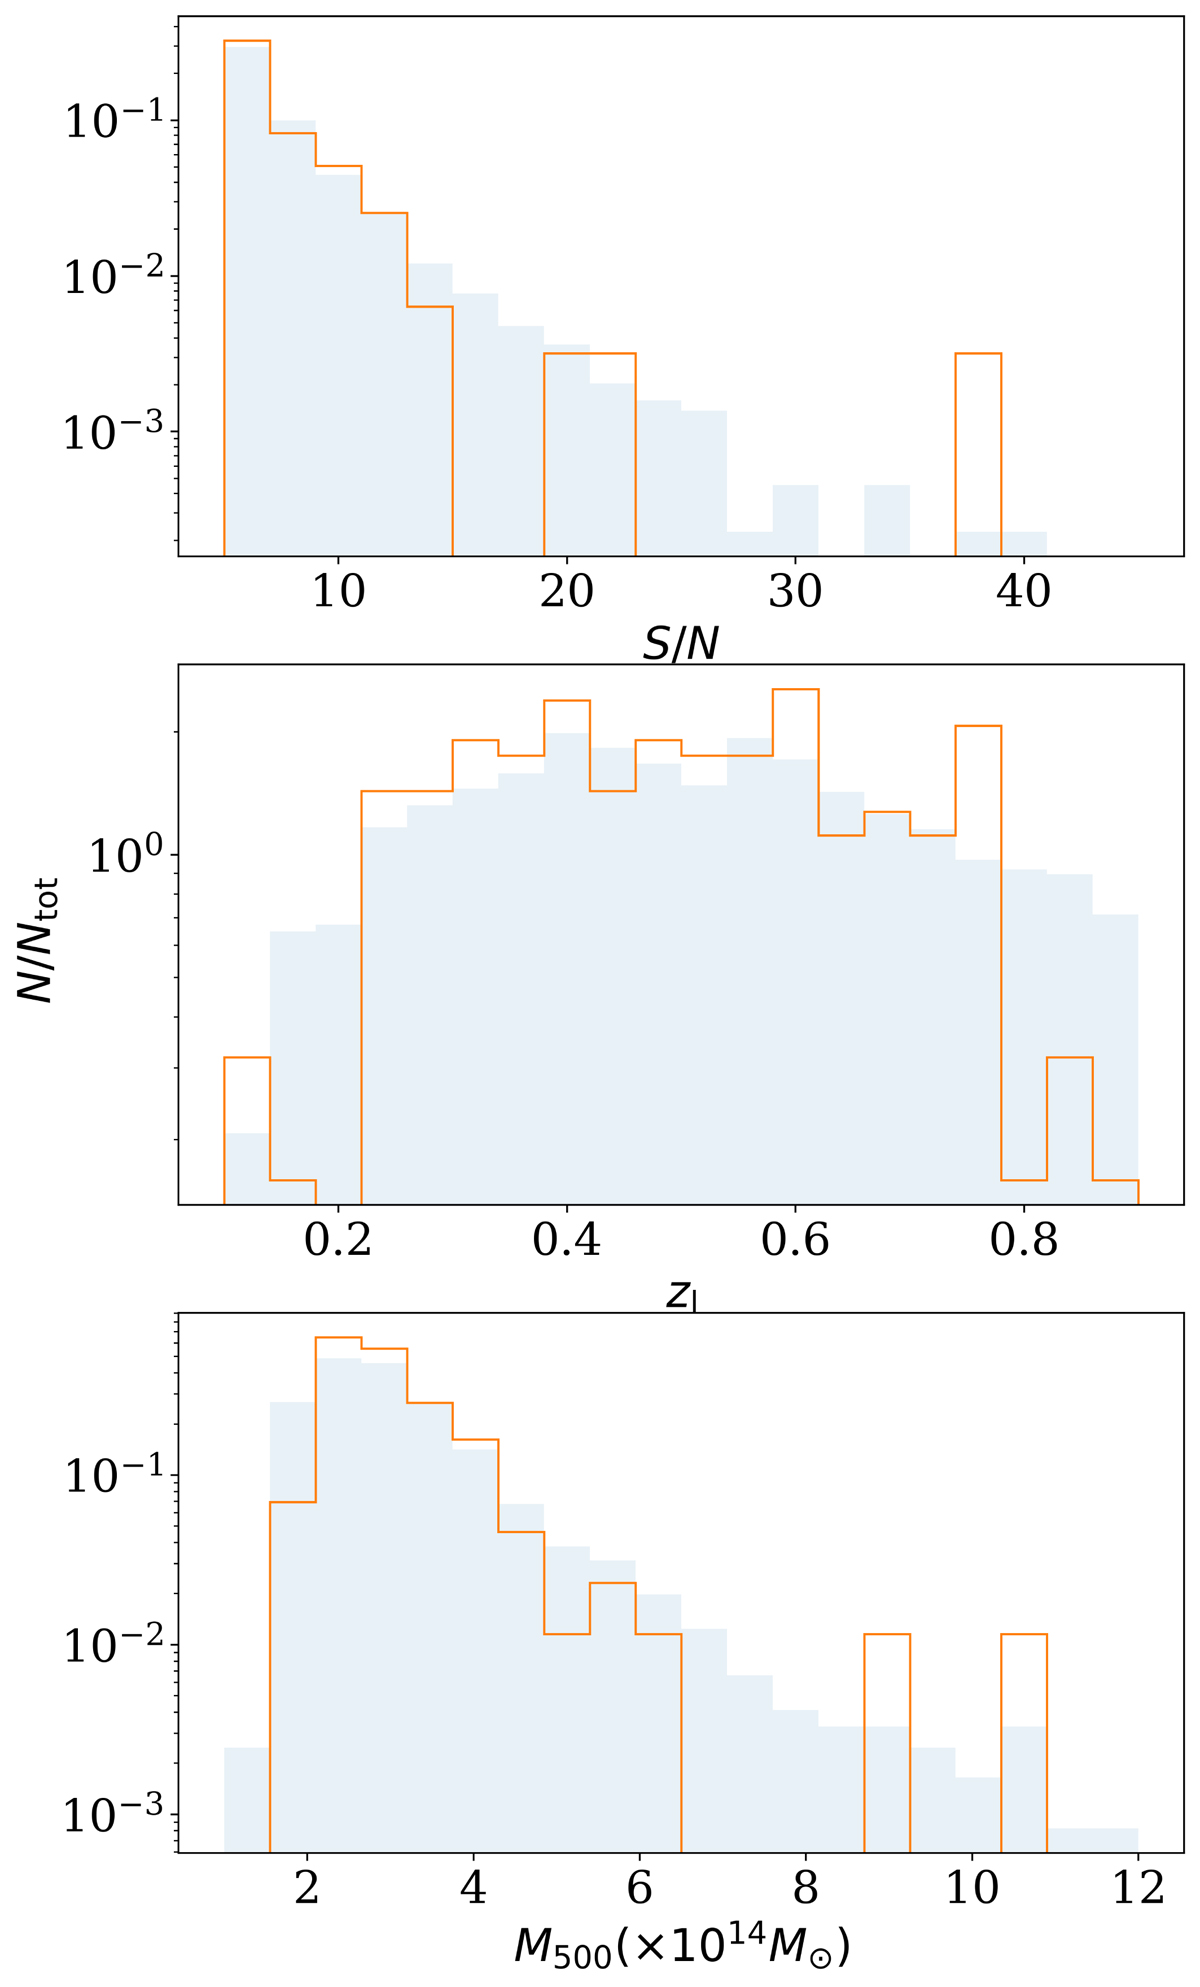
Download original image
Upper: normalised SZ signal-to-noise distribution of the ACT clusters found in the KiDS-1000 region. Middle: normalised redshift distribution of these clusters. Lower: normalised SZ-derived mass distribution of these clusters, estimated from the SZ observable Compton–y values. The blue shaded region corresponds to clusters selected to have an SZ signal-to-noise greater than 5 and in the redshift range 0.1–0.9 across the full ACT footprint. The orange line corresponds to the selection of 157 clusters used in this analysis that lie within the KiDS footprint.
Current usage metrics show cumulative count of Article Views (full-text article views including HTML views, PDF and ePub downloads, according to the available data) and Abstracts Views on Vision4Press platform.
Data correspond to usage on the plateform after 2015. The current usage metrics is available 48-96 hours after online publication and is updated daily on week days.
Initial download of the metrics may take a while.