Fig. 1.
Download original image
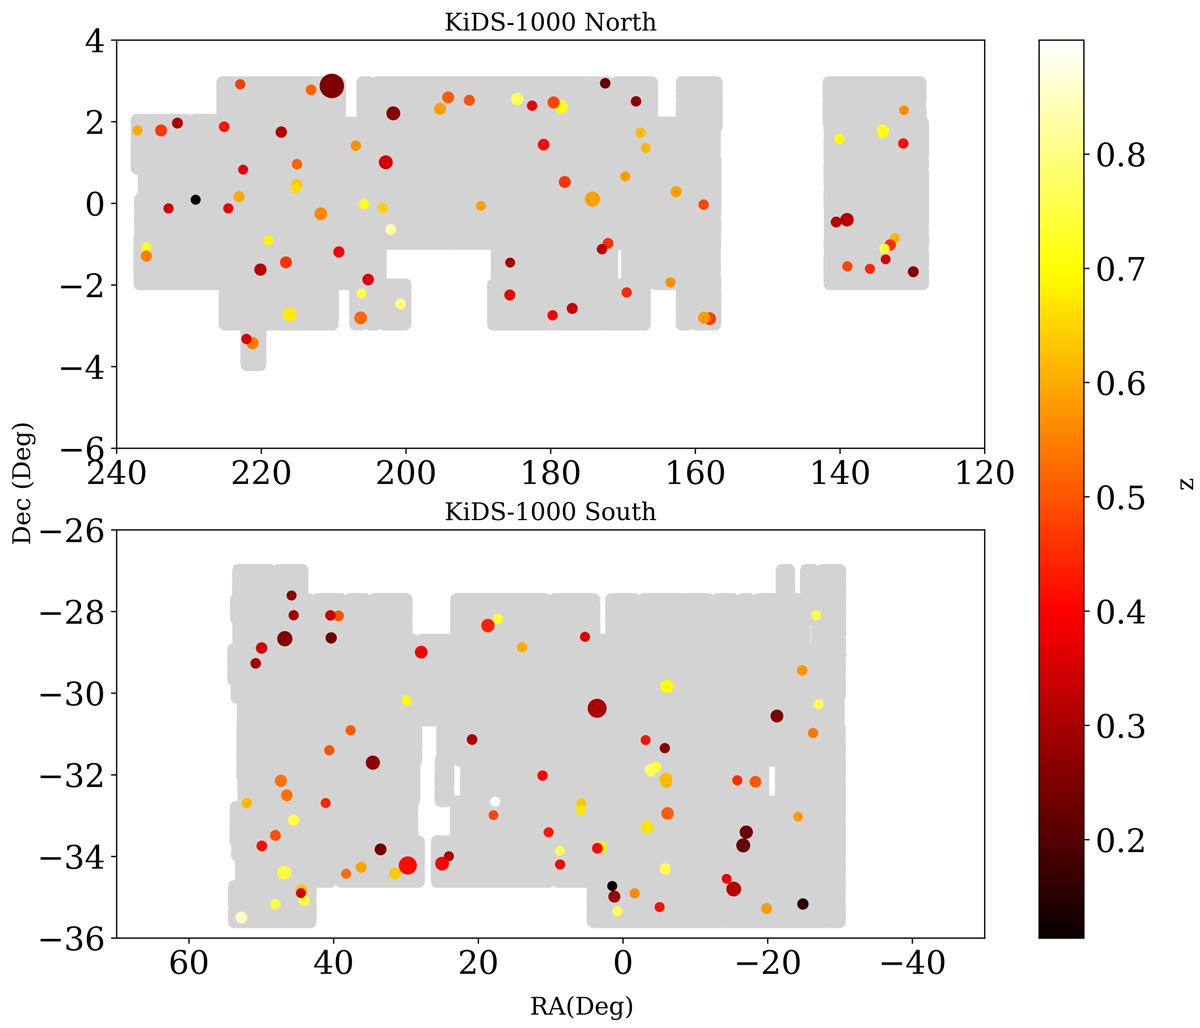
KiDS North and South survey areas are shown in light grey in the upper and lower panels, respectively. The positions of ACT clusters used in this analysis are indicated by each circle. The colour of the circles corresponds to cluster redshift, with yellow indicating high redshift and black indicating low redshift. The size of each circle scales with the SZ signal-to-noise, which is correlated with the cluster mass when the noise is the same everywhere, such that larger circles represent clusters with a greater SZ signal-to-noise than smaller circles.
Current usage metrics show cumulative count of Article Views (full-text article views including HTML views, PDF and ePub downloads, according to the available data) and Abstracts Views on Vision4Press platform.
Data correspond to usage on the plateform after 2015. The current usage metrics is available 48-96 hours after online publication and is updated daily on week days.
Initial download of the metrics may take a while.