| Issue |
A&A
Volume 681, January 2024
|
|
|---|---|---|
| Article Number | A44 | |
| Number of page(s) | 15 | |
| Section | Galactic structure, stellar clusters and populations | |
| DOI | https://doi.org/10.1051/0004-6361/202346231 | |
| Published online | 08 January 2024 | |
Tracing Population III supernovae with extreme energies through the Sculptor dwarf spheroidal galaxy⋆
1
Dipartimento di Fisica e Astronomia, Universitá degli Studi di Firenze, Via G. Sansone 1, 50019 Sesto Fiorentino, Italy
e-mail: This email address is being protected from spambots. You need JavaScript enabled to view it.
2
INAF/Osservatorio Astrofisico di Arcetri, Largo E. Fermi 5, 50125 Firenze, Italy
Received:
23
February
2023
Accepted:
25
April
2023
Abstract
The Sculptor dwarf spheroidal galaxy is old and metal-poor, making it ideal to study the earliest chemical enrichment in the Local Group. We followed up on the most metal-poor star known in this (or any external) galaxy, AS0039, with high-resolution ESO VLT/UVES spectra. Our new analysis confirmed its low metallicity, [Fe/H]LTE = −3.90 ± 0.15, and that it is extremely C-poor, with A(C) = + 3.60, which corresponds to [C/Fe]LTE = −0.33 ± 0.17 (accounting for internal mixing). This adds to the evidence of Sculptor being intrinsically C-poor at low [Fe/H] ≲ −3. However, here we also report a new discovery of a carbon-enhanced metal-poor (CEMP-no) star in Sculptor, DR20080, with no enhancement of Ba, indicative of enrichment by zero-metallicity low-energy supernovae, ESN < 1 × 1051. This is the first piece of evidence of a dual population of CEMP-no and C-normal stars in Sculptor at [Fe/H] ≤ −3. The fraction of CEMP-no stars is still low, fCEMPScl = 9−8+11% at −4 ≤ [Fe/H] ≤ −3, compared to the significantly higher fraction in the Milky Way halo, fCEMPMW ≈ 40%. To further investigate the early chemical enrichment of Sculptor, we re-derived chemical abundances of light, α, iron-peak, and neutron-capture elements in all Sculptor stars at [Fe/H] ≤ −2.8, with available high-resolution spectra. Our results show that at these low [Fe/H], Sculptor is deficient in light elements (e.g. C, Na, Al, Mg) relative to both the Milky Way halo, and ultra-faint dwarf galaxies, pointing towards a significant contribution from high-energy supernovae. Furthermore, the abundance pattern of the star AS0039 is best fitted with a zero-metallicity hypernova progenitor, ESN = 10 × 1051, with a mass of M = 20 M⊙. Our results in Sculptor, at [Fe/H] ≤ −3, therefore suggest significant enrichment by both very low-energy supernovae and hypernovae, solidifying this galaxy as one of the benchmarks for understanding the energy distribution of the first supernova in the Universe.
Key words: stars: abundances / stars: carbon / stars: chemically peculiar / stars: Population III / galaxies: abundances / galaxies: individual: Sculptor
ESO ID 107.22SJ; based on observations made with ESO VLT at the La Silla Paranal observatory under programmes ID 107.22SJ, 0101.B-0189, and 0101.D-0210, as well as on data obtained from the ESO Science Archive Facility.
© The Authors 2024
 Open Access article, published by EDP Sciences, under the terms of the Creative Commons Attribution License (https://creativecommons.org/licenses/by/4.0), which permits unrestricted use, distribution, and reproduction in any medium, provided the original work is properly cited.
This article is published in open access under the Subscribe to Open model. This email address is being protected from spambots. You need JavaScript enabled to view it. to support open access publication.
1. Introduction
The properties of the first stars in the Universe remain elusive. Although the impact of the first metal-free stars was significant since they provided the first ionising radiation, metals, and dust in the Universe, their study is challenging. No metal-free – Population III (Pop III) – star has been observed to date, and it is unclear whether the newly launched JWST telescope will be able to directly observe Pop III galaxies (Wang et al. 2022) or Pop III supernovae (SNe; e.g. Regős et al. 2020; Yan et al. 2023).
At the present moment, the most convincing observational constraints for the properties of Pop III stars come from observing ancient stars in the Milky Way and its satellite galaxies. In particular, the carbon-enhanced metal-poor (CEMP-no) stars ([C/Fe] > +0.7, no Ba or Eu enhancements; e.g. Beers & Christlieb 2005; Norris et al. 2013; Bonifacio et al. 2015; Norris & Yong 2019) are commonly accepted as the direct descendants of Pop III stars, 10 ≲ M⋆/M⊙ ≲ 100, which ended their lives as faint SNe, polluting their environments mainly with C and the lighter elements (Z < 20) resulting in very high [C/Fe] ratios (e.g. Iwamoto et al. 2005; Marassi et al. 2014; de Bennassuti et al. 2017; Hartwig et al. 2018; Welsh et al. 2022, 2023; Rossi et al. 2023). The fraction of these CEMP-no stars in the Milky Way becomes higher towards lower metallicity, with  at [Fe/H] ≤ −3, and as high as
  at [Fe/H] ≤ −4 (e.g. Placco et al. 2014). The small ultra-faint dwarf galaxies (UFDs) seem to follow the same pattern, with very high ratios of CEMP-no stars, compatible with the Milky Way halo (e.g. Salvadori et al. 2015; Ji et al. 2020). However, the situation is less clear in the more massive dwarf galaxies.
The Sculptor dwarf spheroidal (dSph) galaxy is one of the best studied systems at low metallicity (Tafelmeyer et al. 2010; Frebel et al. 2010a; Kirby & Cohen 2012; Starkenburg et al. 2013; Skúladóttir et al. 2015b, 2021; Jablonka et al. 2015; Simon et al. 2015; Chiti et al. 2018). Its stellar population is predominantly old, > 10 Gyr (de Boer et al. 2012; Bettinelli et al. 2019), metal-poor, ⟨[Fe/H] = −1.8⟩, and its chemical abundances are relatively homogeneous (Kirby et al. 2009, 2010; Skúladóttir et al. 2015a, 2017, 2018; Skúladóttir et al. 2019; Hill et al. 2019; de los Reyes et al. 2020). Until now, however, only one very metal-poor ([Fe/H] ≤ −2) star has been discovered to be C-rich relative to the normal population (and with [Ba/Fe] < 0), that is the CEMP-no star ET0097 at [Fe/H] = −2 (Skúladóttir et al. 2015b), while none has been confirmed with intermediate- to high-resolution spectroscopy at [Fe/H] ≤ −3. The fraction of CEMP-no stars therefore seems significantly smaller than in the Milky Way,  at [Fe/H] ≤ −3 (Starkenburg et al. 2013; Skúladóttir et al. 2015b).
As valuable as the CEMP-no stars are, they are only expected to probe a limited fraction of the parameter space of the first stars, characterised by low energy of their SNe. The Pop III stars are predicted to end their lives as SNe of a range of explosion energies (Heger & Woosley 2002), but this remains poorly explored. However, recently, stars have been identified in Sculptor (Skúladóttir et al. 2021) and the Milky Way halo (Placco et al. 2021; Mardini et al. 2022), showing evidence of being imprinted by high-energy SNe. It still remains unclear whether the smaller UFDs would be able to retain the products of such high energy Pop III SNe (e.g. Lee et al. 2024; Rossi et al., in prep.). The initial mass function (IMF) at birth of Pop III stars has been predicted to be top-heavy (e.g. Hirano et al. 2015; Sharda & Krumholz 2022; Sharda et al. 2023), that is to say that the first stars were typically more massive than present-day stars. This conclusion is supported by models using the non-detection of Pop III to constrain the IMF of the first stars (Magg et al. 2018, 2019; Rossi et al. 2021). In particular, Pop III stars in the mass range 140 ≤ M⋆/M⊙ ≤ 260 are predicted to explode as pair-instability supernovae (PISNe), enriching their environment with unique yields, showing a very strong odd-even effect (e.g. Heger & Woosley 2002; Salvadori et al. 2019; Aguado et al. 2023). Small UFD galaxies are unlikely to be able to retain the products of the very energetic PISN. Their descendants are therefore more likely to be found in more massive systems, such as dSph galaxies, or the Galactic bulge (Pagnini et al. 2023).
The ancient and metal-poor Sculptor dSph offers a unique opportunity to expand our current knowledge of the first population of stars in the Universe. Being significantly larger, Mtot ≳ 4 × 10⁸ (Battaglia et al. 2008), than the UFD galaxies, Sculptor is likely to retain more of the products of high-energy SNe, which might be lost in galaxies with a smaller potential well. Currently, Sculptor is the external galaxy with the most known stars at [Fe/H] ≤ −3, many of which have been observed with high-resolution spectra, which is necessary for a detailed and high-precision abundance analysis. Here we add pieces to help solve the puzzle of Pop III stars with: (i) an analysis of a new high-quality spectra of one of the most metal-poor stars in any external galaxy, AS0039; (ii) the discovery of the first CEMP-no star in Sculptor at [Fe/H] ≤ −3; and (iii) a homogeneous (re)analysis of the 11 most metal-poor stars in Sculptor which have high-resolution (R ≳ 20 000) spectra, including one unpublished star at [Fe/H] = −2.8. Thereby we provide the most complete picture of the earliest chemical evolution of any external galaxy to date.
2. Observational data
2.1. New data
Here we present previously unpublished data of three Sculptor stars: AS0039, DR20080, and UHAL004. Their spectra are described in Table 1, while their basic properties, such as positions and photometric values, are in Table 2 and Fig. 1, according to Gaia Early Data Release 3 (eDR3; Gaia Collaboration 2021).
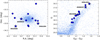 |
Fig. 1. Position on the sky (left) and location on the RGB (right) for our Sculptor stellar sample, based on Gaia DR3 (Table 2). Star symbols with labels are stars with new spectra, which are analysed for the first time here; whereas, large blue circles are stars with available literature spectra, which are re-analysed here. Small, light blue points are stars from Gaia eDR3 within a 1.5 deg radius of the centre of Sculptor. |
Observational log for the new spectra, analysed here for the first time.
The stars AS00039 and DR20080 in the Sculptor dSph were discovered to be metal-poor through a large ESO VLT/FLAMES survey of the Ca II near-infrared triplet (ESO ID 0102.B-0786; Tolstoy et al. 2023). They were followed up on by the same programme with VLT/X-shooter, for confirmation of their low-metallicity, and here we report basic results (Fe and C) for DR20080 using this spectrum. The X-shooter discovery spectrum of AS0039 was analysed and the results are published in Skúladóttir et al. (2021). Here we present an analysis based on a new, higher-quality UVES spectrum. The star AS00039 shows evidence of being a binary, with vrad = 130.5 ± 1.0 km s−1 (Aug.–Sep. 2021), which is significantly different from vrad = 135 ± 1 km s−1 reported from the X-shooter spectrum (Dec 2018; Skúladóttir et al. 2021). Gaia identifies one other star within 5″ from AS0039; however, its colours are not compatible with the red giant branch (RGB) of the Sculptor dSph (G = 19.02, GBP − GRP = 1.96; see Fig. 1), so the companion star is not identified. Finally, the star UHAL004 was observed via the VLT/FLAMES programme with ID 0101.D-0210(A), and discovered to be very metal-poor. The available spectra consist of FLAMES/UVES and FLAMES/GIRAFFE spectra, as listed in Table 1.
2.2. Archival data
To have a clear and homogeneous picture of the earliest chemical enrichment in Sculptor, spectra of all previously published stars with [Fe/H] ≤ −3 (Tafelmeyer et al. 2010; Starkenburg et al. 2013; Jablonka et al. 2015) were retrieved from the ESO archive. In addition, fully reduced spectra for three stars, observed with Magellan/MIKE, were obtained through private communication with A. Frebel and J. Simon (Frebel et al. 2010a; Simon et al. 2015). For convenience, all archival stars are given new names here, referring to the initials of the first author where the spectra we use were first presented (see Table 2).
Positions, magnitudes and atmospheric parameters of the stellar sample, including references to literature work (in parenthesis when the spectrum is different from that analysed here).
Several of the archival stars have been analysed in more than one publication, either with the same spectra (Tafelmeyer et al. 2010; Frebel et al. 2010a; Simon et al. 2015), or different spectra (Starkenburg et al. 2013; Jablonka et al. 2015). Details of the spectral properties are listed in the respective papers. We note that the star ES03170 does not, to our knowledge, have available high-resolution (R ≳ 20 000) spectra, and the star MT00750 is lacking spectral coverage to measure the C abundance. The positions and magnitudes of the entire stellar sample is listed in Table 2. Finally, we note that the stars JS14296 and JS66402 are the faintest of the HR sample (Simon et al. 2015), and accordingly also those with the lowest signal-to-noise ratio (S/N).
3. Atmospheric parameters
3.1. Effective temperature Teff
The effective temperatures, Teff, were determined using photometry from Gaia eDR3 (Gaia Collaboration 2021) and the GBP − GRP calibration from Mucciarelli & Bellazzini (2020). We evaluated the extinction by converting the known extinction of E(V − I) = 0.027 in the direction of Sculptor1 (Schlafly & Finkbeiner 2011) to E(GBP − GRP) = 0.024 (Busso et al. 2018). A typical random error of ΔTeff = 86 K was adopted as the quadratic sum arising from the following: uncertainties as to the photometry, 0.01 mag for GBP and GRP (Gaia Collaboration 2021); an error on [Fe/H], 0.20 dex; and the σTeff of the GBP − GRP calibration for giants, 83 K (Mucciarelli & Bellazzini 2020).
Spectroscopic temperatures have been shown to be typically lower than the photometric scales. Furthermore, Mucciarelli & Bonifacio (2020) show that this difference increases towards lower metallicity, and they conclude that this is likely a direct consequence of 3D non-local thermodynamical equilibrium (NLTE) effects of individual Fe I lines. This effect can be limited by rejecting lines with an excitation potential < 1.4 eV, as was done for example in Tafelmeyer et al. (2010) and Jablonka et al. (2015). As expected, our photometric Teff scale is thus higher compared to those that used the spectroscopic method: ⟨ΔTeff⟩ ≈ +200 K compared to the works of Frebel et al. (2010a), Tafelmeyer et al. (2010), and Simon et al. (2015); and ⟨ΔTeff⟩ ≈ +100 K with Jablonka et al. (2015). On the other hand, our Teff scale agreed on average within 50 K with the photometric Teff of Starkenburg et al. (2013).
3.2. Surface gravity log g
The surface gravities, log g, were evaluated using Gaia eDR3 photometry and the standard relation:
 (1)
(1)
Here the distance modulus is (m − M)0 = 19.67 ± 0.16 (Gaia Collaboration et al. 2018), and the mass of the star is assumed to be M⋆ = 0.8 ± 0.2 M⊙. The solar values used are the following: log g⊙ = 4.44, Teff,⊙ = 5772 K, and Mbol,⊙ = 4.74. The typical random error is Δlog g = 0.14, arising from an error in the G photometry (negligible), Teff, and M⋆.
Analogous to Teff, our log g scale is higher than the spectroscopically determined scale. This is a direct consequence of the different 3D NLTE effects of Fe I and Fe II lines (e.g. Amarsi et al. 2016) whose equilibrium is typically enforced by the spectroscopic method. Therefore, log g − log gAF = +0.5 when compared to Frebel et al. (2010a), and ⟨log g − log gJS⟩= + 0.3 to Simon et al. (2015), while other studies agree on average within ≤0.06 dex (Tafelmeyer et al. 2010; Starkenburg et al. 2013; Jablonka et al. 2015).
3.3. The microturbulence velocity
For the microturbulence velocity, vturb, we used the empirical relation presented in Kirby et al. (2009):
 (2)
(2)
The typical error is Δvturb = 0.1 km s−1, as derived from the errors included in the equation, along with the error on log g (Sect. 3.2). This relationship is well tested along a wide range of [Fe/H], and it has shown not to produce any significant trends with the equivalent width (e.g. Reichert et al. 2020; Lucchesi et al. 2020), and none were found in a specific test we performed for AS0039, the star with the lowest metallicity.
4. Chemical abundance analysis
Our stellar sample includes 13 stars in the Sculptor dSph galaxy at [Fe/H] ≤ −2.8. However, two out of these, DR20080 and ES03170, do not have HR spectra available, and for those stars we only measured Fe and C (along with Ba) to increase the statistics for the fraction of CEMP-no stars in Sculptor at low [Fe/H]. For the remaining 11 stars with HR spectra, we performed a full abundance analysis. All measured abundances are listed in Table 3. The solar abundances were adopted from Asplund et al. (2021), and all literature data discussed and shown in this paper have been put on the same scale.
Chemical abundance measurements (LTE) for the Sculptor stellar sample.
4.1. Stellar atmosphere models and linelists
The stellar atmosphere models have been adopted from MARCS2 (Gustafsson et al. 2008) for stars with a standard composition, 1D, and assuming local thermodynamic equilibrium (LTE), interpolated to match the stellar parameters for the target stars. The abundance analysis was carried out with the spectral synthesis code TURBOSPEC3 (Alvarez & Plez 1998; Plez 2012), and all individual measurements take blends of other elements into account. Atomic parameters were adopted from the VALD4 database (Kupka et al. 1999), retrieved in October 2019. Finally, the molecular list for CH was obtained from Masseron et al. (2014).
4.2. Chemical abundance measurements
Chemical abundances and/or upper limits were measured for two elements from the LR spectra (two stars): Fe, C, along with an upper limit of Ba for DR20080. For the HR spectra, up to 16 elemental abundances were measured (11 stars): Fe, C, Mg, Na, Al, Si, Ca, Sc, Ti, Cr, Mn, Co, Ni, Zn, Sr, and Ba. Typical errors arising from the uncertainties in stellar parameters were estimated based on a representative star for the sample: [Fe/H] = −3.4; Teff = 4650 K; log g = 1.2; and vt = 1.9 km s−1. Individual components of the error were estimated from synthetic spectra, as arising from ΔTeff = 86 K, Δlog g = 0.14, and vt = 0.1 km s−1, and then combined quadratically. Thus we estimated Δ[Fe/H] = 0.11 and Δ[X/Fe] ≈ 0.1 − 0.10 for individual elements measured from atomic lines, Δ[X/Fe], while Δ[C/Fe] = 0.15. The error resulting from stellar parameters was added quadratically to the random observational errors. All measured abundances, upper limits, and uncertainties are listed in Table 3.
The C abundance was measured from the CH G-band at ∼430 nm in 12 out of our 13 stars (MT00749 lacked the spectral coverage). The strength of these molecular lines is affected by the assumed O abundance, which influences how much of C is locked into CO. The available spectra did not allow us to reliably measure the O abundance, hence we adopted [O/Fe] = +0.6, corresponding to the average value at −2.5 ≤ [Fe/H] ≤ −2 in Sculptor (Hill et al. 2019), and this is also in agreement with the Milky Way halo (Amarsi et al. 2019). A combination of low C, high Teff > 4750 K, and low S/N lead to only upper limits for the stars AF20549, JS14296, and JS66402. Figure 2 shows the spectra of the only CEMP star in the sample, DR20080, around the G-band, comparing it to a C-normal star.
 |
Fig. 2. X-shooter spectrum for the CEMP-no star in our sample, DR20080 (red), at [Fe/H] = −3. For a fair comparison, the X-shooter spectrum of PJ07402 at the same [Fe/H] = −3 is also shown in blue (Starkenburg et al. 2013). However, for the full chemical abundance analysis of PJ07402, here we use a HR UVES spectrum from Jablonka et al. (2015). |
The light, odd element Na was measured with the Na I D resonance lines at 589.0 and 589.6 nm, while the Al abundance came from one blue neutral line at 396.2 nm. Both elements were measured in nine stars, but spectral coverage was missing for two stars in each case.
Elemental abundances for three α-elements were measured – Mg, Si, and Ca – as well as the often grouped-together element Ti. We used two Mg I lines in the blue at 382.8 and 383.8 nm, and the Mg I triplet at 516.7, 517.2, and 518.3 nm. The Si abundance was determined from one neutral line at 390.6 nm, while five Ca I lines were used: 422.7, 430.3, 445.5, 612.2, and 616.2 nm. Finally, Ti was measured by 28 Ti II lines, ranging from 370 to 530 nm. In Fig. 3 the spectral fits are shown for two lines (Mg I and Ca I) for the new UVES spectrum of AS0039.
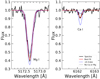 |
Fig. 3. Spectrum of AS0039 (black), showing lines of Mg I (left) and Ca I (right). Red shows the best fit, blue is ±0.4 from that, and grey shows synthetic spectra without the elements in question. |
For the odd iron-peak elements, we measured Sc using four Sc II lines at 424.7, 431.4, 432.1, and 432.5 nm. The Mn was measured from the Mn I triplet at 403 nm, shown in Fig. 4 for the three most metal-poor stars in our sample. Using eight weak Co I lines from 384 to 413 nm, we were able to measure Co in seven of our stars. Due to lack of blue spectral coverage, we were unable to measure Sc, Mn, or Co in MT00749 and UHAL004. In addition, the low S/N in JS14296 and JS66402 prevented us from making reliable Co measurements, and the Co in AF20549 is only based on one line (413 nm).
 |
Fig. 4. Spectra of the strong resonance Mn I triplet for the three most metal-poor stars in our sample, [Fe/H] ≈ −3.85. |
We measured four even iron-peak elements: Cr, Fe, Ni, and Zn. In total, six Cr I lines were used for the measurement of Cr, at 425.4, 427.5, 429.0, and the triplet at 520 nm. The Fe abundance was measured from up to 61 Fe I lines in the wavelength range 400 − 570 nm, as this was the range covered by most spectra. For the intermediate-resolution X-shooter spectra (DR20080 and ES03170) the same linelist was used. However, due to the lower resolution, some of the weaker lines were not reliably measurable in these stars, though this was somewhat compensated for by the above average [Fe/H] = −3, compared to the rest of the sample. Thus for DR20080, [Fe/H] was measured using 29 Fe I lines, while ES03170 was based on 35 lines (this star had spectra with a higher S/N). Up to six Ni I lines were used at 380.7, 383.2, 385.8, 391.3, 397.4, and 547.7 nm. For the stars JS14296, JS66402, MT00749, and UHAL004, the Ni abundance is only based on the reddest line at 547.7 nm. For AF20549, even this line was too weak to measure. Finally, Zn was measured in the eight stars with the highest S/N, using the line at 481.1 nm.
The neutron-capture elements Sr and Ba were measured, using two Sr II lines at 407.8 and 421.6 nm, and up to three Ba II lines at 455.4, 614.2, and 649.7 nm. The wavelength range of the bluest line was unfortunately only covered in five stars, AF20549, JS14296, JS66402, MT00749, and MT00750; however, all HR spectra included the wavelength covering of the two redder lines. An upper limit of [Ba/Fe] < −0.5 was measured for the star DR20080 from the 614.2 nm line in the X-shooter spectrum, confirming it to be a CEMP-no star.
4.3. AS0039 – NLTE abundances
For a detailed comparison with theoretical models (Sect. 6), accurate chemical abundances are fundamental. Thus, we provide NLTE corrections to the abundance measurements of AS0039, the most metal-poor star in our sample. The NLTE chemical abundances for AS0039, along with the size of the NLTE corrections, are listed in Table 4.
NLTE chemical abundances of the star AS0039.
The chemical abundance measurements of Fe I, Ca I, and Ti II were corrected for NLTE effects, on a line-to-line bases, according to Mashonkina et al. (2016), using the publicly available online tool5. The abundances of Mg, Si, Cr, and Co were corrected with the MPIA-NLTE database6 (Bergemann & Cescutti 2010; Bergemann et al. 2010, 2013, 2017). The Na correction was based on the work of Lind et al. (2011), and the Al correction is based on Nordlander & Lind (2017). The NLTE correction of Mn was based on the most metal-poor giant models provided by Bergemann et al. (2019). Finally, the Zn NLTE corrections were adopted from Takeda et al. (2005). Corrections of Sc, Sr, and Ba are expected to be small (e.g. Bergemann et al. 2012; Zhang et al. 2014) and were neglected here. For the molecular CH lines, 3D corrections are not available but are expected to result in lower abundances (Caffau et al. 2011a; Norris & Yong 2019) compared to the [C/H]LTE used in this work.
When there were several lines of the species available, the NLTE corrections reduced the scatter between lines in all cases except for Ti II. However, the NLTE corrections for Ti II are of the order of ∼+0.03 dex, and thus negligible compared to the random errors of singular lines.
4.4. Comparison to the literature
By comparing our results to the previous literature studies of the nine re-analysed stars in our sample (Table 2), it becomes clear that our metallicity scale is higher, ⟨[Fe/H] − [Fe/H]lit⟩= + 0.17. This is a direct consequence of adopting the photometric Teff scale, which is higher than the spectroscopic scale (see Sect. 3 and Mucciarelli & Bonifacio 2020 for a general discussion). The difference in abundance ratios is smaller, with for example ⟨[Mg/Fe] − [Mg/Fe]lit⟩= + 0.08. When compared to Chiti et al. (2018), there are five stars in common, AF20549, JS14296, MT00750, PJ03059, and ES03170, which in their work are named, respectively, 10_8_1072, 11_1_4296, 10_7_923, 10_8_320, and 10_8_61. The average difference between our analysis and theirs is ⟨[Fe/H] − [Fe/H]Chiti⟩= + 0.01 and σ = 0.17. Out of these five stars, four have only upper limit measurements by us and/or Chiti et al. (2018). For PJ03059, the one star with C measurements by both works, ⟨[C/Fe] − [C/Fe]Chiti⟩= − 0.36, which is in agreement within the errors.
The LTE chemical abundances for AS0039 based on the HR UVES spectra are in general agreement with those from the X-shooter discovery spectrum (Skúladóttir et al. 2021). In the present work, the metallicity is higher, [Fe/H]UVES − [Fe/H]X − shooter = +0.21, with average differences in abundance ratios ⟨[X/Fe]UVES − [X/Fe]X−shooter⟩ = −0.03, and the differences have an average size of ⟨|[X/Fe]UVES − [X/Fe]X − shooter|⟩ = +0.23. A notable outlier is Ca, with [Ca/Fe]X − shooter = +0.65 ± 0.11 and [Ca/Fe]UVES = +0.06 ± 0.12. For the weak lines used in both works (422.7 and 616.2 nm), it is quite likely that unfortunately placed noise affected the X-shooter measurements. However, these lines were in good agreement with the strong infrared Ca II triplet (849.9, 854.2, and 866.2 nm) in the X-shooter spectra. Unfortunately the UVES spectra do not have the wavelength coverage of the Ca II triplet, preventing further comparison. With the exception of Ca, the chemical abundances of AS0039 as measured with X-shooter are consistent with the higher-quality UVES analysis.
5. The metal-poor chemical abundances in Sculptor
The chemical abundance measurements (LTE) of our Sculptor stars are listed in Table 3, and shown in Figs. 5–11. In the following subsections, we discuss the results and put them in context with the metal-poor Milky Way halo and the UFDs. In particular, in Sect. 5.6, we quantitatively compare the overall abundance patterns in different galaxies.
 |
Fig. 5. Abundance ratios of [C/Fe] with log g in Sculptor (blue), the Milky Way (grey), and UFDs (yellow), as measured (top panel), and after applying corrections for internal mixing (bottom panel) according to Placco et al. (2014). Two green lines in the top panel note the predicted evolutionary track of [C/Fe] in stars born with [C/Fe] = +0.7, and 0, repeated with dotted lines in the bottom panel for visual aid. Milky Way data are from Roederer et al. (2014), and the UFD references are listed in Sect. 5. |
 |
Fig. 6. Abundance ratios of [C/Fe] with [Fe/H] in Sculptor (blue symbols), the Milky Way (grey squares) and UFDs (yellow stars), corrected for internal mixing (Placco et al. 2014), excluding CEMP-s stars. References for the Milky Way and UFDs are listed in Sect. 5. |
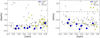 |
Fig. 7. Light odd elements, [Na/Fe] and [Al/Fe] with [Fe/H] for Sculptor (blue), the Milky Way (grey), and UFDs (yellow). Star symbols represent the Sculptor stars analysed using new spectra, while blue circles are the stars that are re-analysed on archival spectra. |
 |
Fig. 8. Abundances of the α-elements, [Mg/Fe], [Si/Fe], and [Ca/Fe], along with [Ti/Fe], with [Fe/H] for Sculptor (blue), the Milky Way (grey), and UFDs (yellow). Star symbols represent the Sculptor stars analysed here using new spectra, while blue circles are the stars that are re-analysed on archival spectra. |
 |
Fig. 9. Iron-peak elements Sc, Cr, Mn, Co, Ni, and Zn relative to Fe, as a function of [Fe/H] for Sculptor (blue), the Milky Way (grey), and UFDs (yellow). Star symbols represent the Sculptor stars analysed here using new spectra, while blue circles are the stars that are re-analysed on archival spectra. |
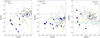 |
Fig. 10. Abundance ratios of the neutron-capture elements in Sculptor (blue), the Milky Way (grey), and UFDs (yellow): [Sr/Fe] (left) and [Ba/Fe] (middle) as a function of [Fe/H], and [Sr/Ba] (right) as a function of [Ba/H]. For reference, the [Sr/Ba] value of the r-process-enhanced star CS 22892-052 (Sneden et al. 2003) is noted with a green dashed line. Star symbols represent the Sculptor stars analysed here using new spectra, while blue circles are the stars that are re-analysed on archival spectra. Milky Way data come from Roederer et al. (2014), and UFD references are listed in the beginning of Sect. 5. |
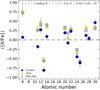 |
Fig. 11. Average abundance pattern at −4 ≤ [Fe/H] ≤ −2.7 in Sculptor (blue), the Milky Way (grey), and UFDs (yellow), with the error of the mean, σ/ |

For the Milky Way, we use literature data from the following works: Cayrel et al. (2004), Christlieb et al. (2004), Norris et al. (2007), Caffau et al. (2011b), Yong et al. (2013), Hansen et al. (2014), Keller et al. (2014), Roederer et al. (2014), Frebel et al. (2015), Bonifacio et al. (2015, 2018), Li et al. (2015), François et al. (2018), Starkenburg et al. (2018), Aguado et al. (2019), Ezzeddine et al. (2019), and Lombardo et al. (2022). For the UFDs we use data from the JINA database7 (Abohalima & Frebel 2018), which includes: Norris et al. (2010), Simon et al. (2010), Frebel et al. (2010b, 2016), Ishigaki et al. (2014), Roederer et al. (2016), François et al. (2016), and Ji et al. (2016b,a). For C abundances we also include the following UFD references: Lai et al. (2011), Ji et al. (2020). For duplicate entries of the same stars, the original publication is used. All literature abundances are put on the solar scale of Asplund et al. (2021), see Tables 3 and 4.
5.1. Carbon
The C abundance on the surface of RGB stars is modified by internal dredge-up and mixing (e.g. Gratton et al. 2000; Spite et al. 2006). To correct for this effect, we used the online tool8 provided by Placco et al. (2014). Figure 5 shows both the measured abundances, [C/Fe]obs, and those corrected for mixing, [C/Fe]corr, as a function of log g. The average size of the correction for the Sculptor sample is ⟨ Δ[C/Fe] ⟩= + 0.5. We note that adopting lower log g would lead to higher corrections. In general, our log g scale is in good agreement with the literature (Sect. 3.2), with the exception of Frebel et al. (2010a) and Simon et al. (2015), where Δlog g ≳ 0.3. However, for those three stars, we were only able to provide upper limits (see Fig. 5), and our results are in general agreement with Frebel et al. (2010a) and Simon et al. (2015), who have categorised these stars as C-normal.
In the case of [C/Fe]obs (Fig. 5, top), there is a steep negative gradient with the evolutionary stage, that is decreasing log g, as is expected from theory. After applying the corrections, the trend was flattened at log g < 1. However, we note that the three most evolved stars are still significantly lower in [C/Fe]corr compared to the other C-normal stars, with [C/Fe]corr = −0.5, while other C-normal stars are consistent with [C/Fe]corr ≈ 0.0. Given that the three most evolved stars (AS0039, PJ00306, and UHAL004) cover the entire metallicity range of the sample, it is likely that this is an artificial effect, produced either by underestimation of the C-corrections at low log g < 1 and/or differences in 3D effects of the CH band. If the corrections are underestimated at low log g, our presented abundances are too low; however, adding 3D corrections to the abundances derived from the G-band lowers these abundances (e.g. Norris & Yong 2019). For the lack of a better alternative, we have accepted the abundances as presented, with the aforementioned caveats. In any case, it is unambiguous that these three evolved stars are all C-normal, [C/Fe] < +0.7.
Figure 6 shows [C/Fe]corr (from here on labelled [C/Fe]) as a function of [Fe/H]. In the Sculptor sample of 12 stars at −4 < [Fe/H] ≤ −2.8, only one star, DR20080, is carbon-enhanced, [C/Fe] > +0.7 (see also Fig. 2). This star has [Ba/Fe] < −0.5 (Table 3), and is therefore a bon afide CEMP-no star. This gives a fraction  at [Fe/H] ≤ −3.0, while the fractions measured in the literature in the Milky Way and UFDs are fCEMP ≈ 40% (Placco et al. 2014; Ji et al. 2020). Furthermore, we emphasise that at [Fe/H] < −3.5, there is no known CEMP-no star in Sculptor, while the fraction in the Milky Way halo and UFDs is fCEMP > 60%. Therefore, it is evident that although CEMP-no stars do exist in Sculptor (Skúladóttir et al. 2015b; and here), their fraction is significantly lower in Sculptor compared to the Milky Way halo and the UFDs. This dearth of CEMP-no stars in Sculptor has been noted previously in the literature (e.g. Starkenburg et al. 2013; Skúladóttir et al. 2015b, 2021), and is further solidified with this work. This clearly points to a different chemical enrichment in Sculptor at the earliest epochs, compared to both the Milky Way halo and the UFDs. This is further discussed in Sect. 6.
5.2. Light odd elements, Na and Al
The abundances of the light odd elements Na and Al are shown in Fig. 7. Sculptor follows the lower envelope of [Na/Fe] values observed in the Milky Way and UFDs, with all but the most metal-rich star, UHAL004, having sub-solar [Na/Fe] < 0. A similar picture arises with [Al/Fe], where the Sculptor abundances are typically lower than the median of the Milky Way. The UFDs show a bimodal behaviour in [Al/Fe], either being similar to Sculptor, or very high with [Al/Fe] > 0. We note that all the supersolar abundances in UFDs in Fig. 7 are from the same reference (François et al. 2016), but the authors find similar results for several UFDs (Boötes II, Hercules, Leo IV).
From Fig. 7 it is clear that Sculptor is significantly lower in the abundances of light odd elements, Na and Al, relative to Fe, compared to other depicted galaxies. The low Na is likely closely related to the dearth of CEMP-no stars in Sculptor since such stars are known to often also have high Na and Al (e.g. Norris et al. 2013). But even when only considering C-normal RGB stars, the Sculptor values are typically lower than the median of Milky Way data, suggesting an intrinsic lack of these elements in the earliest chemical enrichment of Sculptor.
5.3. The α-elements
The α-elements Mg, Si, and Ca, along with the often grouped-together Ti, are shown relative to Fe in Fig. 8. In the elements Mg and Ca, there is a decreasing trend of [Mg,Ca/Fe] towards lower [Fe/H]. This was already identified in the literature compilation of these Sculptor stars (Skúladóttir et al. 2021), where low Mg and/or low Ca at [Fe/H] < −3.5 were previously noted in Sculptor stars by Tafelmeyer et al. (2010), Frebel et al. (2010a), Jablonka et al. (2015), and Simon et al. (2015). Here we confirm that this is not a result of inhomogenities between different works. This trend is not seen in the Milky Way halo, nor in the UFDs. However, data in other dSph galaxies are lacking at these low [Fe/H] < −3.5, hence it is unclear whether this trend is typical for dSph galaxies or if it is unique to Sculptor.
Our analysis also suggests a lower Si in Sculptor compared to the Milky Way halo and UFDs. This was also found in individual stars by Tafelmeyer et al. (2010) and Simon et al. (2015), while the results of Jablonka et al. (2015) were more in line with the Milky Way. The star AF20549 was found to have very high [Si/Fe] = 0.96 ± 0.39 by Frebel et al. (2010a), which is in agreement with the value obtained here, [Si/Fe] = 0.62 ± 0.26, given the large errors in this moderate S/N spectra. We emphasise that Si was measured using only one line, making it more uncertain than the other α-elements reported here.
Contrary to the α-elements, Ti does not show any clear evidence of behaving differently in Sculptor and the other galaxies depicted in Fig. 8. Furthermore, there is no signature of a decreasing nor an increasing trend of [Ti/Fe] with [Fe/H]. Therefore, only the traditional α-elements, Mg, Si, and Ca, are different in Sculptor at the lowest [Fe/H] < −3.5, compared to the Milky Way halo and the UFDs.
5.4. Iron-peak elements
Figure 9 shows the [X/Fe] for the iron-peak elements Sc, Cr, Mn, Co, Ni, and Zn as a function of [Fe/H]. The abundances of [Sc/Fe] in Sculptor are in general agreement with the Milky Way halo and UFDs, especially at the lowest [Fe/H] < −3.5, while the higher values of [Sc/Fe] > +0.2 are missing in Sculptor while observed in the other galaxies at [Fe/H] > −3.3. Similarly to Na, Al, and Sc, [Cr/Fe] in Sculptor also follows the lower envelope of the Milky Way, being consistent with the UFDs. Furthermore, [Co/Fe] is lower in Sculptor compared to the other galaxies.
On the other hand, the Mn in Sculptor is in very good agreement with both the Milky Way halo and UFDs, showing a very large scatter in [Mn/Fe] and typically sub-solar values (in LTE). We note that the three most metal-poor stars in Sculptor generally agree remarkably well in regards to their abundance patterns (Figs. 7–9); however, in [Mn/Fe] there are significant differences as to their values. Furthermore, for these three stars, the [Mn/Fe] is anti-correlated with their Teff (see Fig. 4). We note that the abundances presented here, and shown in Fig. 9, have not been corrected for NLTE effects which are predicted to be around Δ[Mn/H]NLTE ≈ +0.5 in Bergemann et al. (2019), or even as high as Δ[Mn/H]NLTE ≈ +1 in some works (Bergemann & Gehren 2008). The complete NLTE abundances therefore might reduce the differences. However, the available work on NLTE does not predict such sharp differences in the Teff range presented here; therefore, the Teff-[Mn/Fe] anti-correlation is plausibly only a coincidence based on low number statistics.
Finally, both Ni and Zn in Sculptor are in very good agreement with the Milky Way halo evolution as well as the UFDs. In particular, Ni, which is easier to measure and thus has less random errors, shows roughly [Ni/Fe] ≈ 0 in Sculptor, as well as in the Milky Way and the smaller UFDs. Similar to the Milky Way halo (e.g. Cayrel et al. 2004; Lombardo et al. 2022), Sculptor has increasing [Zn/Fe] ratios towards lower [Fe/H]. Very few Zn measurements are available in UFDs, but in general they are consistent with the larger galaxies.
Overall we find fewer differences between Sculptor and the other galaxies in the iron-peak elements, compared to the lighter elements presented in Figs. 6–8. Given the uncertainties and possible systematic errors, we conclude that the iron-peak elements in Sculptor have a similar behaviour as the other galaxies, albeit not always identical.
5.5. Neutron-capture elements
The neutron-capture elements Sr and Ba, relative to Fe, are shown in Fig. 10. We note that the four UFD stars with [Ba/Fe] > 0 and [Sr/Fe] > 0 belong to r-process-enhanced Reticulum II (Ji et al. 2016c,d; Roederer et al. 2016). Excluding these outliers, the [Sr/Fe] and [Ba/Fe] ratios in Sculptor are in good agreement with UFDs, as well as the Milky Way halo. At the earliest stages in these galaxies, AGB stars had not yet become a dominant source of these elements, leading to extremely low, sub-solar ratios, relative to Fe. We note that the scatter in our [Sr/Fe] and [Ba/Fe] measurements is significant, providing clear evidence of inhomogeneous mixing in these elements at the earliest times in Sculptor. A compatible result (albeit with fewer data points) was found by Reichert et al. (2020), as well as Mashonkina et al. (2016).
The right panel of Fig. 10 shows the [Sr/Ba] ratio. Again, Sculptor is in very good agreement with the Milky Way halo and the UFDs at low [Ba/H] < −3. As a reference, we denote the [Sr/Ba] of the r-process-enhanced star CS 22892-052 (Sneden et al. 2003). However, very r-process-enriched stars, with [Eu/Fe] > +1, cover more than a dex spread in −0.7 ≲ [Sr/Ba] ≲ +0.7 (Holmbeck et al. 2020). Similarly, very s-process-enriched CEMP-s stars cover a similar range in [Sr/Ba] (e.g. Hansen et al. 2019; Goswami et al. 2021). Traditionally, specific weak r- and/or s-processes (e.g. Travaglio et al. 2004; Arcones & Montes 2011) are provoked to explain the high [Sr/Ba] ratios observed in some halo stars (e.g. Honda et al. 2004), in dwarf galaxies (e.g. Skúladóttir et al. 2015b; Susmitha et al. 2017; Spite et al. 2018), and in one ω Centauri star (Yong et al. 2017). The abundance pattern of such stars has been successfully explained, for example with fast rotating, low-metallicity massive stars (Cescutti et al. 2013; Choplin et al. 2017, 2018; Yong et al. 2017; Skúladóttir et al. 2020), but the origin of these stars is still being debated. Based on the observational scatter in [Sr/Ba] in both s-process-enriched stars as well as r-process-rich ones, it seems likely that the [Sr/Ba] ratio is sensitive to the physical conditions on each site, as well as possibly Sr having a contribution from several processes.
5.6. The general abundance pattern
Figure 11 shows the average abundance pattern from the data shown in Figs. 6–9 at the metallicity range of the Sculptor data, −4 < [Fe/H] < −2.7, with the error of the mean,  . Upper limits in Sculptor and the UFDs that are informative, that is lower than the mean [X/Fe], are included as measurements. All upper limits in [C/Fe] are included for the Sculptor average. Despite this very conservative estimate of ⟨[C/Fe]⟩Scl, it is clear that Sculptor is remarkably devoid of C compared to the Milky Way halo and the UFDs (see also Fig. 6).
Furthermore, the lighter elements show a similar trend, where in particular Na, Al, and Si have significantly lower values in Sculptor compared to other galaxies. Less significantly, [Mg/Fe] and [Ca/Fe] in Sculptor are lower than in the Milky Way and UFDs. We note that Mg and Ca are consistent with the other systems at higher [Fe/H] ≳ −3.5, and they only deviate at the lowest [Fe/H]. However, when looking at elements from Ti and those that are heavier in Fig. 11, it is clear that the abundance pattern in Sculptor converges with the Milky Way halo and the UFDs, and the different galaxies are generally in very good agreement.
The peculiarities of the Sculptor average abundance pattern are likely closely associated with the galaxy’s dearth of CEMP-no stars (Sect. 5.1; e.g. Skúladóttir et al. 2015b). Indeed, CEMP-no stars – especially at low [Fe/H] – have shown an enhancement of the lighter elements (Z ≲ 20), while the heavier elements are more in line with C-normal stars in the Milky Way halo (e.g. Norris et al. 2013). This is clear evidence that low-energy SNe, the progenitors of CEMP-no stars (e.g. Iwamoto et al. 2005; Rossi et al. 2023; Vanni et al. 2023a), have not had as great an impact on Sculptor as the Milky Way halo and the UFDs. Ultimately, this raises the question as to from where the earliest chemical enrichment in Sculptor arises.
6. Primordial hypernovae in Sculptor
To interpret the chemical abundances of the Sculptor stars, we used the parametric model for early chemical enrichment presented in Salvadori et al. (2019) to study the signature of very massive Pop III stars and then extended in Vanni et al. (2023a,b) to uncover the imprint of Pop III stars with a different mass and explosion energy. This broad and general model studies the chemical abundances in the primordial galaxies after the pollution of a single Pop III star with a mass of M* ∈ [10; 1000] M⊙, an SN explosion energy of ESN ∈ [0.3; 100]×1051 erg, and mixing of fmix ∈ [0; 0.25]. For this work, we have excluded stars with M* > 100 M⊙ (and ESN > 10 × 1051 erg) and used for the remaining ones the yields from Heger & Woosley (2010). Moreover, the model explores how these abundances change with the contamination of normal Pop II stars at different levels. The unknowns on the early phases of the stellar formation and evolution are wrapped in three free parameters: the star formation efficiency of Pop III stars, the dilution factor of the metals, and the fraction of metals coming from Pop III stars with respect to the total. Readers can refer to Vanni et al. (2023b) and Salvadori et al. (2019) for further details and a comprehensive explanation of the model properties.
6.1. The progenitor of AS0039
The star AS0039 is the most metal-poor star known in any external galaxy. The abundance pattern of this star is in general agreement with two other Sculptor stars at a similar [Fe/H]LTE < −3.7 (see Fig. 6–10); also, due to its brightness (see Fig. 1, and Table 2), its S/N is higher (see e.g. Fig. 4). Thus, in the following, we use AS0039 as representative of the earliest chemical enrichment in Sculptor and use the NLTE abundances provided in Table 4. In Fig. 12 we compare the abundances of AS0039 computed in both LTE (square points) and NLTE (star points), with the abundances predicted by our model for the pure (100%) descendants of Pop III stars with a fixed mass of 20 M⊙ and mixing of fmix = 0.063 for four different SN explosion energies (Heger & Woosley 2010).
 |
Fig. 12. Comparison between the measured chemical abundance pattern, [X/Fe], of the star AS0039 (red) in LTE (squares) and NLTE (stars) with model predictions (lines) for the pure descendants of a Pop III 20 M⊙ star with fixed mixing fmix = 0.063. Different colours denote different SN explosion energies for Pop III stars: 0.3 × 1051 erg (blue), 1.2 × 1051 erg (green), 5 × 1051 erg (yellow), and 10 × 1051 erg (orange). |
First, we noticed that the abundances of AS0039 better agree with the descendants of high-energy, ESN ≥ 5 × 1051 erg, Pop III SNe (yellow and orange points), which are the only ones for which the model predicts [C/Fe] < 0. Moreover, our models predict very similar abundances for the descendants of low- and high-energy SNe for the elements heavier than Sc, while they are very different for the lighter metals, most of all C. This suggests that the abundances of the elements lighter than Sc might be the key to understand the pollution history of AS0039 and the other environments presented in Fig. 11: the Milky Way stellar halo, UFDs, and Sculptor. Indeed, the abundance ratios presented in Figs. 11 and 12, if compared, suggest that, on average, Sculptor has been polluted by more energetic primordial SNe with respect to the Milky Way halo and the UFDs, which, on the other side, might have been more dominated by the ejecta of low-energy Pop III SNe Rossi et al. (2023), and in prep).
Given the good agreement between AS0039 and the descendants of high-energy Pop III SNe for a given mass and mixing, we directly compared its abundances with theoretical models varying the mass, the SN explosion energy, and the mixing of the Pop III progenitor star. We computed χ2 between the chemical abundances of AS0039 and the ones predicted by 100% of the Pop III descendants as follows:
![Mathematical equation: $$ \begin{aligned} \chi ^2_\circ =\sum ^N_{i=1} \dfrac{\left(\mathrm{[X_i/Fe]}_{\rm obs}-\mathrm{[X_i/Fe]}_{\rm th}\right)^2}{\left(\sigma ^2_{\mathrm{[X_i/Fe]}_{\rm obs}}+\sigma ^2_{\mathrm{[X_i/Fe]}_{\rm th}}\right)}, \end{aligned} $$](/articles/aa/full_html/2024/01/aa46231-23/aa46231-23-eq11.gif) (3)
(3)
where [Xi/Fe]obs, th and ![Mathematical equation: $ \sigma^2_{{\rm[X_i/Fe]}_{\rm obs, th}} $](/articles/aa/full_html/2024/01/aa46231-23/aa46231-23-eq12.gif) are the measured and theoretical abundance ratios and standard deviations. In order to account for the uncertainties on Pop III stellar yields, quantified by Nomoto et al. (2013) and Hartwig et al. (2018) in σ[Xi/Fe]th ∼ 0.3 − 1.0 dex, we assume
are the measured and theoretical abundance ratios and standard deviations. In order to account for the uncertainties on Pop III stellar yields, quantified by Nomoto et al. (2013) and Hartwig et al. (2018) in σ[Xi/Fe]th ∼ 0.3 − 1.0 dex, we assume ![Mathematical equation: $ \sigma^2_{{\rm [X_i/Fe]}_{\rm th}}=0.25 $](/articles/aa/full_html/2024/01/aa46231-23/aa46231-23-eq13.gif) . Finally, we define scaled
. Finally, we define scaled  .
.
The best fit suggests that AS0039 was primarily enriched by a Pop III hypernovae, ESN = 10 × 1051 erg, with M* ≈ 20 M⊙, regardless of the mixing. This result is in agreement with the best fit computed with the online abundance-fitting tool Starfit9 (see Heger & Woosley 2010). However, there are degeneracies in the models and, taking into account uncertainties of the chemical abundances, there can be several models that produce satisfactory fits. Therefore, it is important to explore the parameter space to ensure that the best fit does not represent a single solution, but that it is representative of the best solution space.
The results of the χ2 analysis are presented in Fig. 13, where we show the goodness of fit with different colours when varying the mass, the mixing, and the SN explosion energy of the Pop III progenitor. For simplicity, we provide examples with fixed M* = 20 M⊙, in the top panel, and fixed fmix = 0.063, in the bottom panel. Regardless of the mixing, for a 20 M⊙ Pop III progenitor, the descendants of Pop III hypernovae (ESN ≥ 5 × 1051 erg) have the minimum χ2, while the worst agreement is with the descendants of Pop III SNe with ESN ≤ 1.2 × 1051 erg. For fixed fmix, it is evident that the number of descendants with a good agreement with AS0039 drastically decreases for the lowest-energy Pop III SN progenitors. Indeed, we find the minimum χ2 for the descendants of high-energy SNe (ESN ≥ 2.4 × 1051 erg) with masses between 12 M⊙ and 40 M⊙.
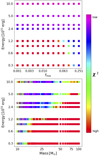 |
Fig. 13. Comparison of the observed abundances of AS0039 (NLTE) to theoretical predictions for pure descendants of Pop III stars, varying their SN explosion energy, mixed fraction, and initial mass. In the upper panel, we fixed the initial mass to 20 M⊙, and, in the lower panel, we fixed the mixed fraction to fmix = 0.063. Best fits are magenta, while the worst fits, with χ2 ≥ 5 (i.e. ≥5 times the minimum), are shown with a red colour. |
The best fit to the abundance pattern of AS0039, as well as exploration of the parameter space (Figs. 12–13), strongly suggest this star was primarily enriched by a primordial Pop III hypernova, with M ≈ 20 M⊙. Since AS0039 has a similar abundance pattern to other low [Fe/H]LTE < −3.7 stars in the galaxy, this points to an earliest chemical enrichment in Sculptor that was dominated by high-energy SNe. Assuming the same NLTE corrections derived for AS0039, we find that also the two stars MT00750 and PJ03111 are best fitted by the descendants of high-energy Pop III SNe. In particular, MT00750 agrees with the descendant of a 15 M⊙ hypernova (ESN = 10 × 1051 erg) without dependence on fmix, while PJ03111 agrees with the descendant of a 14.4 M⊙ high-energy SN (ESN = 2.4 × 1051 erg) with fmix = 0.0251.
6.2. The imprints of high-energy SN in Sculptor
In Fig. 14 we compare the results of our model (Vanni et al. 2023b) for [C/Fe] as a function of [Fe/H] for observational data in the dSph galaxies – Sculptor, Fornax, Carina, and Sextans – along with those observed in the Milky Way and UFDs. We note that literature data are typically only provided in LTE; however, NLTE affects in iron in metal-poor giants are expected to be of the order of Δ[Fe/H] ≈ +0.25 (see Table 4), and are expected to affect [Fe/H] as well as [C/Fe] (shown with arrow in Fig. 14). The [C/Fe] are even lower when taking 3D effects into account, which affect C measurements from molecular lines (Norris & Yong 2019).
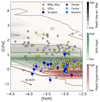 |
Fig. 14. Density maps of the [C/Fe] with respect to [Fe/H] as predicted by our model for the descendants of Pop III stars (shaded areas) and measured abundances (LTE) of stars in Sculptor (blue circles), Sextans (medium-blue hexagons), Carina (light-blue hexagons), Fornax (purple pentagons), the UFDs (yellow triangles), and the Milky Way (grey squares). All measured [C/Fe] abundances have been corrected for internal mixing (Placco et al. 2014). The black arrow shows the expected size and direction of how measured stellar abundances are expected to change because of NLTE effects in [Fe/H]. The shaded areas are coloured depending on the type of stars that polluted the descendants: 100% of the Pop III low-energy SNe (grey, ESN < 1.5 × 1051 erg), 100% of the Pop III hypernovae (red, ESN > 5.0 × 1051 erg), 50% of the low-energy Pop III SNe, and 50% of the core-collapse Pop II SNe (green). The densest areas (and most probable abundances) are coloured with darker shades. In all cases, fmix = 0.063. References for the Milky Way and UFDs are listed in Sect. 5. The data of dSph galaxies are from Tafelmeyer et al. (2010), and from Lucchesi et al. (2020, 2023). |
We show the [C/Fe] abundances predicted by our model for the descendants of pure low-energy Pop III SNe (grey), and pure hypernovae descendants (red), that is to say 100% of the metals from these different types of Pop III SNe. Furthermore, we show an intermediate case, where the descendants have been polluted only at a 50% level by low-energy Pop III SNe and the remaining 50% metals are provided by normal Pop II SNe (green area). The density diagrams were created exploring all the possible initial masses of Pop III stars (i.e. 10 − 100 M⊙), with a mixing of fmix = 0.063. The contribution of Pop II stars is, on the other hand, integrated over a normal Larson IMF (see Salvadori et al. 2019).
The majority of the stars pertaining to the dSph galaxies are carbon normal (the maximum is [C/Fe] ≈ +1), while the MW and UFDs have stars with [C/Fe] ≥ +2.0. The high values of [C/Fe] in these two latter environments can be explained only with the pure descendants of low-energy Pop III SNe, with ESN < 1.5 × 1051 erg, which expel low amounts of iron (see Vanni et al. 2023a,b). The stars with lower [C/Fe] values agree better with the pollution of both low-energy Pop III SNe and Pop II stars. However, when taking into account the predicted NLTE effects, the [C/Fe] values of most stars in Sculptor and Carina are too low to be explained with these two cases. Indeed, their very low [C/Fe] value can only be explained by a strong imprint by Pop III hypernovae. The dSph galaxies might thus be fundamental for understanding the energy distribution of Pop III SNe (Koutsouridou et al. 2023).
7. Conclusions
We present an analysis of a newly obtained HR UVES spectrum for AS0039 in the Sculpor dSph galaxy, providing both LTE and NLTE abundances. This star is confirmed to be the most metal-poor star in any external galaxy, with [Fe/H]LTE = −3.90 and [C/Fe]LTE = −0.33 (corrected for internal mixing). To avoid systematic errors, we re-analysed all the archival spectra available to us at [Fe/H] ≤ −3 in Sculptor, and provide an analysis for two stars published for the first time in this work: UHAL004 at [Fe/H] = −2.8 and a CEMP-no star, DR20080, discovered here at [Fe/H] = −3.
Out of the 11 Sculptor stars with carbon measurements at [Fe/H] ≤ −3, only one is a CEMP-no star, giving a fraction of  , which is at odds with fractions measured in the Milky Way and UFDs, fCEMP ≈ 40% (Placco et al. 2014; Ji et al. 2020). This is a further confirmation that Sculptor is remarkably devoid of CEMP-no stars, as noted by previous works (Starkenburg et al. 2013; Skúladóttir et al. 2015b, 2021).
Here, we clearly show that these peculiarities in Sculptor reach beyond carbon. Compared to the Milky Way and UFDs, the metal-poor Sculptor stars have lower [X/Fe] ratios in light elements (e.g. Na, Al, Mg, Si). On the other hand, heavier elements, from Ti and beyond, are generally in good agreement with chemical abundances both in the Milky Way halo and UFDs. This unique abundance pattern in Sculptor is consistent with enrichment from Pop III stars with high explosion energy, ESN > 2 × 1051 erg, which are predicted to produce low ratios of [X/Fe] for lighter elements, while heavier elemental ratios ([X/Fe], Z ≳ 20) are less sensitive to explosion energy (Heger & Woosley 2002). The average abundance pattern of the Milky Way and UFDs is remarkably similar, while being clearly different from that of Sculptor. This result is somewhat at odds with the prediction that the Milky Way halo is mostly made up by massive dSph galaxies (e.g. Deason et al. 2016). However, it is unclear how the earliest chemical enrichment of those Milky Way progenitors differentiated from that of the present-day satellite dSph galaxies.
When comparing our Sculptor results with theoretical models, the (NLTE) abundance pattern of the most metal-poor star in our sample, AS0039, is best explained by it being mainly enriched by a zero-metallicity hypernovae, ESN = 10 × 1051 erg, with a mass of M = 20 M⊙, which is in good agreement with previous analyses of the discovery X-shooter spectrum (Skúladóttir et al. 2021). This result is robust, and obtained regardless of the adopted mixing.
The [C/Fe] abundances measured in Sculptor were compared to our general parametric model, further confirming this conclusion. The very low [C/Fe] abundances suggest that the Sculptor dSph galaxy hosted at least one Pop III hypernova, which dominated its earliest enrichment, overshadowing the impact of lower-energy SNe. We emphasise that Pop III faint SNe are still likely to have occurred in the galaxy (and/or in its progenitors) since they are needed to explain the existence of CEMP-no stars (see also Salvadori et al. 2015), which have been detected at [Fe/H] = −3 (DR20080) and [Fe/H] = −2 (Skúladóttir et al. 2015b).
Our results show that Sculptor is massive enough to be able to retain the products of such energetic events. This suggests that dSph galaxies are key objects to study the full parameter space of Pop III stars, that is their mass distribution and the energy distribution of their SNe. This is further supported by available data in other dSph galaxies, which have low [C/Fe] and relatively few CEMP-no stars, compared to the Milky Way and UFDs.
The upcoming large spectroscopic surveys will provide more data on dSph galaxies, in particular 4DWARFS: the 4MOST survey of dwarf galaxies and their stellar streams (Skúladóttir et al. 2023) is expected to make a great leap forward. However, to be able to fully exploit the data to reveal the properties of the first stars, sophisticated physically driven models (e.g. Rossi et al. 2021, 2023), targeted at the earliest chemical enrichment in dSph galaxies are crucially needed. By combining data with models, the Sculptor dSph galaxy – and other similar galaxies – might be our best chance at understanding the energy distribution of the first SNe in the Universe.
Acknowledgments
The authors thank J. Simon and A. Frebel for readily sharing their data. This project has received funding from the European Research Council (ERC) under the European Union’s Horizon 2020 research and innovation programme (grant agreement No. 804240). This work has made use of data from the European Space Agency (ESA) mission Gaia (https://www.cosmos.esa.int/gaia), processed by the Gaia Data Processing and Analysis Consortium (DPAC, https://www.cosmos.esa.int/web/gaia/dpac/consortium). Funding for the DPAC has been provided by national institutions, in particular the institutions participating in the Gaia Multilateral Agreement.
References
- Abohalima, A., & Frebel, A. 2018, ApJS, 238, 36 [NASA ADS] [CrossRef] [Google Scholar]
- Aguado, D. S., González Hernández, J. I., Allende Prieto, C., & Rebolo, R. 2019, ApJ, 874, L21 [NASA ADS] [CrossRef] [Google Scholar]
- Aguado, D. S., Salvadori, S., Skúladóttir, Á., et al. 2023, MNRAS, 520, 866 [NASA ADS] [CrossRef] [Google Scholar]
- Alvarez, R., & Plez, B. 1998, A&A, 330, 1109 [NASA ADS] [Google Scholar]
- Amarsi, A. M., Lind, K., Asplund, M., Barklem, P. S., & Collet, R. 2016, MNRAS, 463, 1518 [NASA ADS] [CrossRef] [Google Scholar]
- Amarsi, A. M., Nissen, P. E., & Skúladóttir, Á. 2019, A&A, 630, A104 [NASA ADS] [CrossRef] [EDP Sciences] [Google Scholar]
- Arcones, A., & Montes, F. 2011, ApJ, 731, 5 [CrossRef] [Google Scholar]
- Asplund, M., Amarsi, A. M., & Grevesse, N. 2021, A&A, 653, A141 [NASA ADS] [CrossRef] [EDP Sciences] [Google Scholar]
- Battaglia, G., Helmi, A., Tolstoy, E., et al. 2008, ApJ, 681, L13 [NASA ADS] [CrossRef] [Google Scholar]
- Beers, T. C., & Christlieb, N. 2005, ARA&A, 43, 531 [NASA ADS] [CrossRef] [Google Scholar]
- Bergemann, M., & Cescutti, G. 2010, A&A, 522, A9 [NASA ADS] [CrossRef] [EDP Sciences] [Google Scholar]
- Bergemann, M., & Gehren, T. 2008, A&A, 492, 823 [NASA ADS] [CrossRef] [EDP Sciences] [Google Scholar]
- Bergemann, M., Pickering, J. C., & Gehren, T. 2010, MNRAS, 401, 1334 [CrossRef] [Google Scholar]
- Bergemann, M., Hansen, C. J., Bautista, M., & Ruchti, G. 2012, A&A, 546, A90 [NASA ADS] [CrossRef] [EDP Sciences] [Google Scholar]
- Bergemann, M., Kudritzki, R.-P., Würl, M., et al. 2013, ApJ, 764, 115 [NASA ADS] [CrossRef] [Google Scholar]
- Bergemann, M., Collet, R., Amarsi, A. M., et al. 2017, ApJ, 847, 15 [NASA ADS] [CrossRef] [Google Scholar]
- Bergemann, M., Gallagher, A. J., Eitner, P., et al. 2019, A&A, 631, A80 [NASA ADS] [CrossRef] [EDP Sciences] [Google Scholar]
- Bettinelli, M., Hidalgo, S. L., Cassisi, S., et al. 2019, MNRAS, 487, 5862 [NASA ADS] [CrossRef] [Google Scholar]
- Bonifacio, P., Caffau, E., Spite, M., et al. 2015, A&A, 579, A28 [NASA ADS] [CrossRef] [EDP Sciences] [Google Scholar]
- Bonifacio, P., Caffau, E., Spite, M., et al. 2018, A&A, 612, A65 [NASA ADS] [CrossRef] [EDP Sciences] [Google Scholar]
- Busso, G., Cacciari, C., Carrasco, J. M., et al. 2018, Gaia DR2 documentation Chapter 5: Photometry, Gaia DR2 documentation, 5 [Google Scholar]
- Caffau, E., Ludwig, H. G., Steffen, M., Freytag, B., & Bonifacio, P. 2011a, Sol. Phys., 268, 255 [Google Scholar]
- Caffau, E., Bonifacio, P., François, P., et al. 2011b, Nature, 477, 67 [NASA ADS] [CrossRef] [Google Scholar]
- Cayrel, R., Depagne, E., Spite, M., et al. 2004, A&A, 416, 1117 [NASA ADS] [CrossRef] [EDP Sciences] [Google Scholar]
- Cescutti, G., Chiappini, C., Hirschi, R., Meynet, G., & Frischknecht, U. 2013, A&A, 553, A51 [NASA ADS] [CrossRef] [EDP Sciences] [Google Scholar]
- Chiti, A., Simon, J. D., Frebel, A., et al. 2018, ApJ, 856, 142 [NASA ADS] [CrossRef] [Google Scholar]
- Choplin, A., Hirschi, R., Meynet, G., & Ekström, S. 2017, A&A, 607, L3 [NASA ADS] [CrossRef] [EDP Sciences] [Google Scholar]
- Choplin, A., Hirschi, R., Meynet, G., et al. 2018, A&A, 618, A133 [NASA ADS] [CrossRef] [EDP Sciences] [Google Scholar]
- Christlieb, N., Gustafsson, B., Korn, A. J., et al. 2004, ApJ, 603, 708 [NASA ADS] [CrossRef] [Google Scholar]
- de Bennassuti, M., Salvadori, S., Schneider, R., Valiante, R., & Omukai, K. 2017, MNRAS, 465, 926 [NASA ADS] [CrossRef] [Google Scholar]
- de Boer, T. J. L., Tolstoy, E., Hill, V., et al. 2012, A&A, 539, A103 [NASA ADS] [CrossRef] [EDP Sciences] [Google Scholar]
- de los Reyes, M. A. C., Kirby, E. N., Seitenzahl, I. R., & Shen, K. J. 2020, ApJ, 891, 85 [NASA ADS] [CrossRef] [Google Scholar]
- Deason, A. J., Mao, Y.-Y., & Wechsler, R. H. 2016, ApJ, 821, 5 [NASA ADS] [CrossRef] [Google Scholar]
- Ezzeddine, R., Frebel, A., Roederer, I. U., et al. 2019, ApJ, 876, 97 [NASA ADS] [CrossRef] [Google Scholar]
- François, P., Monaco, L., Bonifacio, P., et al. 2016, A&A, 588, A7 [NASA ADS] [CrossRef] [EDP Sciences] [Google Scholar]
- François, P., Caffau, E., Wanajo, S., et al. 2018, A&A, 619, A10 [Google Scholar]
- Frebel, A., Kirby, E. N., & Simon, J. D. 2010a, Nature, 464, 72 [NASA ADS] [CrossRef] [Google Scholar]
- Frebel, A., Simon, J. D., Geha, M., & Willman, B. 2010b, ApJ, 708, 560 [NASA ADS] [CrossRef] [Google Scholar]
- Frebel, A., Chiti, A., Ji, A. P., Jacobson, H. R., & Placco, V. M. 2015, ApJ, 810, L27 [NASA ADS] [CrossRef] [Google Scholar]
- Frebel, A., Norris, J. E., Gilmore, G., & Wyse, R. F. G. 2016, ApJ, 826, 110 [NASA ADS] [CrossRef] [Google Scholar]
- Gaia Collaboration (Helmi, A., et al.) 2018, A&A, 616, A12 [NASA ADS] [CrossRef] [EDP Sciences] [Google Scholar]
- Gaia Collaboration (Brown, A. G. A., et al.) 2021, A&A, 649, A1 [NASA ADS] [CrossRef] [EDP Sciences] [Google Scholar]
- Goswami, P. P., Rathour, R. S., & Goswami, A. 2021, A&A, 649, A49 [NASA ADS] [CrossRef] [EDP Sciences] [Google Scholar]
- Gratton, R. G., Sneden, C., Carretta, E., & Bragaglia, A. 2000, A&A, 354, 169 [NASA ADS] [Google Scholar]
- Gustafsson, B., Edvardsson, B., Eriksson, K., et al. 2008, A&A, 486, 951 [NASA ADS] [CrossRef] [EDP Sciences] [Google Scholar]
- Hansen, T., Hansen, C. J., Christlieb, N., et al. 2014, ApJ, 787, 162 [NASA ADS] [CrossRef] [Google Scholar]
- Hansen, C. J., Hansen, T. T., Koch, A., et al. 2019, A&A, 623, A128 [NASA ADS] [CrossRef] [EDP Sciences] [Google Scholar]
- Hartwig, T., Yoshida, N., Magg, M., et al. 2018, MNRAS, 478, 1795 [CrossRef] [Google Scholar]
- Heger, A., & Woosley, S. E. 2002, ApJ, 567, 532 [Google Scholar]
- Heger, A., & Woosley, S. E. 2010, ApJ, 724, 341 [Google Scholar]
- Hill, V., Skúladóttir, Á., Tolstoy, E., et al. 2019, A&A, 626, A15 [NASA ADS] [CrossRef] [EDP Sciences] [Google Scholar]
- Hirano, S., Hosokawa, T., Yoshida, N., Omukai, K., & Yorke, H. W. 2015, MNRAS, 448, 568 [NASA ADS] [CrossRef] [Google Scholar]
- Holmbeck, E. M., Hansen, T. T., Beers, T. C., et al. 2020, ApJS, 249, 30 [NASA ADS] [CrossRef] [Google Scholar]
- Honda, S., Aoki, W., Kajino, T., et al. 2004, ApJ, 607, 474 [NASA ADS] [CrossRef] [Google Scholar]
- Ishigaki, M. N., Aoki, W., Arimoto, N., & Okamoto, S. 2014, A&A, 562, A146 [NASA ADS] [CrossRef] [EDP Sciences] [Google Scholar]
- Iwamoto, N., Umeda, H., Tominaga, N., Nomoto, K., & Maeda, K. 2005, Science, 309, 451 [NASA ADS] [CrossRef] [Google Scholar]
- Jablonka, P., North, P., Mashonkina, L., et al. 2015, A&A, 583, A67 [NASA ADS] [CrossRef] [EDP Sciences] [Google Scholar]
- Ji, A. P., Frebel, A., Simon, J. D., & Geha, M. 2016a, ApJ, 817, 41 [NASA ADS] [CrossRef] [Google Scholar]
- Ji, A. P., Frebel, A., Ezzeddine, R., & Casey, A. R. 2016b, ApJ, 832, L3 [CrossRef] [Google Scholar]
- Ji, A. P., Frebel, A., Chiti, A., & Simon, J. D. 2016c, Nature, 531, 610 [NASA ADS] [CrossRef] [Google Scholar]
- Ji, A. P., Frebel, A., Simon, J. D., & Chiti, A. 2016d, ApJ, 830, 93 [NASA ADS] [CrossRef] [Google Scholar]
- Ji, A. P., Li, T. S., Simon, J. D., et al. 2020, ApJ, 889, 27 [NASA ADS] [CrossRef] [Google Scholar]
- Keller, S. C., Bessell, M. S., Frebel, A., et al. 2014, Nature, 506, 463 [NASA ADS] [CrossRef] [Google Scholar]
- Kirby, E. N., & Cohen, J. G. 2012, AJ, 144, 168 [NASA ADS] [CrossRef] [Google Scholar]
- Kirby, E. N., Guhathakurta, P., Bolte, M., Sneden, C., & Geha, M. C. 2009, ApJ, 705, 328 [NASA ADS] [CrossRef] [Google Scholar]
- Kirby, E. N., Guhathakurta, P., Simon, J. D., et al. 2010, ApJS, 191, 352 [NASA ADS] [CrossRef] [Google Scholar]
- Koutsouridou, I., Salvadori, S., Skúladóttir, Á., et al. 2023, MNRAS, 525, 190 [NASA ADS] [CrossRef] [Google Scholar]
- Kupka, F., Piskunov, N., Ryabchikova, T. A., Stempels, H. C., & Weiss, W. W. 1999, A&AS, 138, 119 [NASA ADS] [CrossRef] [EDP Sciences] [Google Scholar]
- Lai, D. K., Lee, Y. S., Bolte, M., et al. 2011, ApJ, 738, 51 [CrossRef] [Google Scholar]
- Lee, T., Jeon, M., & Bromm, V. 2024, MNRAS, 527, 1257 [Google Scholar]
- Li, H., Aoki, W., Zhao, G., et al. 2015, PASJ, 67, 84 [NASA ADS] [CrossRef] [Google Scholar]
- Lind, K., Asplund, M., Barklem, P. S., & Belyaev, A. K. 2011, A&A, 528, A103 [NASA ADS] [CrossRef] [EDP Sciences] [Google Scholar]
- Lombardo, L., Bonifacio, P., François, P., et al. 2022, A&A, 665, A10 [NASA ADS] [CrossRef] [EDP Sciences] [Google Scholar]
- Lucchesi, R., Lardo, C., Primas, F., et al. 2020, A&A, 644, A75 [NASA ADS] [CrossRef] [EDP Sciences] [Google Scholar]
- Lucchesi, R., Jablonka, P., Skúladóttir, Á., et al. 2023, A&A, submitted [Google Scholar]
- Magg, M., Hartwig, T., Agarwal, B., et al. 2018, MNRAS, 473, 5308 [CrossRef] [Google Scholar]
- Magg, M., Klessen, R. S., Glover, S. C. O., & Li, H. 2019, MNRAS, 487, 486 [CrossRef] [Google Scholar]
- Marassi, S., Chiaki, G., Schneider, R., et al. 2014, ApJ, 794, 100 [NASA ADS] [CrossRef] [Google Scholar]
- Mardini, M. K., Frebel, A., Ezzeddine, R., et al. 2022, MNRAS, 517, 3993 [NASA ADS] [CrossRef] [Google Scholar]
- Mashonkina, L. I., Sitnova, T. N., & Pakhomov, Y. V. 2016, Astron. Lett., 42, 606 [Google Scholar]
- Masseron, T., Plez, B., Van Eck, S., et al. 2014, A&A, 571, A47 [NASA ADS] [CrossRef] [EDP Sciences] [Google Scholar]
- Mucciarelli, A., & Bellazzini, M. 2020, Res. Notes Am. Astron. Soc., 4, 52 [Google Scholar]
- Mucciarelli, A., & Bonifacio, P. 2020, A&A, 640, A87 [NASA ADS] [CrossRef] [EDP Sciences] [Google Scholar]
- Nomoto, K., Kobayashi, C., & Tominaga, N. 2013, ARA&A, 51, 457 [CrossRef] [Google Scholar]
- Nordlander, T., & Lind, K. 2017, A&A, 607, A75 [NASA ADS] [CrossRef] [EDP Sciences] [Google Scholar]
- Norris, J. E., & Yong, D. 2019, ApJ, 879, 37 [NASA ADS] [CrossRef] [Google Scholar]
- Norris, J. E., Christlieb, N., Korn, A. J., et al. 2007, ApJ, 670, 774 [NASA ADS] [CrossRef] [Google Scholar]
- Norris, J. E., Yong, D., Gilmore, G., & Wyse, R. F. G. 2010, ApJ, 711, 350 [NASA ADS] [CrossRef] [Google Scholar]
- Norris, J. E., Yong, D., Bessell, M. S., et al. 2013, ApJ, 762, 28 [NASA ADS] [CrossRef] [Google Scholar]
- Pagnini, G., Salvadori, S., Rossi, M., et al. 2023, MNRAS, 521, 5699 [NASA ADS] [CrossRef] [Google Scholar]
- Placco, V. M., Frebel, A., Beers, T. C., & Stancliffe, R. J. 2014, ApJ, 797, 21 [Google Scholar]
- Placco, V. M., Roederer, I. U., Lee, Y. S., et al. 2021, ApJ, 912, L32 [NASA ADS] [CrossRef] [Google Scholar]
- Plez, B. 2012, Astrophysics SourceCode Library [record ascl:1205.004] [Google Scholar]
- Regős, E., Vinkó, J., & Ziegler, B. L. 2020, ApJ, 894, 94 [NASA ADS] [CrossRef] [Google Scholar]
- Reichert, M., Hansen, C. J., Hanke, M., et al. 2020, A&A, 641, A127 [NASA ADS] [CrossRef] [EDP Sciences] [Google Scholar]
- Roederer, I. U., Preston, G. W., Thompson, I. B., et al. 2014, AJ, 147, 136 [Google Scholar]
- Roederer, I. U., Mateo, M., Bailey, J. I. I., et al. 2016, AJ, 151, 82 [NASA ADS] [CrossRef] [Google Scholar]
- Rossi, M., Salvadori, S., & Skúladóttir, Á. 2021, MNRAS, 503, 6026 [NASA ADS] [CrossRef] [Google Scholar]
- Rossi, M., Salvadori, S., Skúladóttir, Á., & Vanni, I. 2023, MNRAS, 522, L1 [NASA ADS] [CrossRef] [Google Scholar]
- Salvadori, S., Skúladóttir, Á., & Tolstoy, E. 2015, MNRAS, 454, 1320 [Google Scholar]
- Salvadori, S., Bonifacio, P., Caffau, E., et al. 2019, MNRAS, 487, 4261 [NASA ADS] [CrossRef] [Google Scholar]
- Schlafly, E. F., & Finkbeiner, D. P. 2011, ApJ, 737, 103 [Google Scholar]
- Sharda, P., & Krumholz, M. R. 2022, MNRAS, 509, 1959 [Google Scholar]
- Sharda, P., Amarsi, A. M., Grasha, K., et al. 2023, MNRAS, 518, 3985 [Google Scholar]
- Simon, J. D., Frebel, A., McWilliam, A., Kirby, E. N., & Thompson, I. B. 2010, ApJ, 716, 446 [NASA ADS] [CrossRef] [Google Scholar]
- Simon, J. D., Jacobson, H. R., Frebel, A., et al. 2015, ApJ, 802, 93 [Google Scholar]
- Skúladóttir, Á., Andrievsky, S. M., Tolstoy, E., et al. 2015a, A&A, 580, A129 [NASA ADS] [CrossRef] [EDP Sciences] [Google Scholar]
- Skúladóttir, Á., Tolstoy, E., Salvadori, S., et al. 2015b, A&A, 574, A129 [NASA ADS] [CrossRef] [EDP Sciences] [Google Scholar]
- Skúladóttir, Á., Tolstoy, E., Salvadori, S., Hill, V., & Pettini, M. 2017, A&A, 606, A71 [NASA ADS] [CrossRef] [EDP Sciences] [Google Scholar]
- Skúladóttir, Á., Salvadori, S., Pettini, M., Tolstoy, E., & Hill, V. 2018, A&A, 615, A137 [NASA ADS] [CrossRef] [EDP Sciences] [Google Scholar]
- Skúladóttir, Á., Hansen, C. J., Salvadori, S., & Choplin, A. 2019, A&A, 631, A171 [NASA ADS] [CrossRef] [EDP Sciences] [Google Scholar]
- Skúladóttir, Á., Hansen, C. J., Choplin, A., et al. 2020, A&A, 634, A84 [NASA ADS] [CrossRef] [EDP Sciences] [Google Scholar]
- Skúladóttir, Á., Salvadori, S., Amarsi, A. M., et al. 2021, ApJ, 915, L30 [CrossRef] [Google Scholar]
- Skúladóttir, Á., Puls, A. A., Amarsi, A. M., et al. 2023, The Messenger, 190, 19 [Google Scholar]
- Sneden, C., Cowan, J. J., Lawler, J. E., et al. 2003, ApJ, 591, 936 [NASA ADS] [CrossRef] [Google Scholar]
- Spite, M., Cayrel, R., Hill, V., et al. 2006, A&A, 455, 291 [NASA ADS] [CrossRef] [EDP Sciences] [Google Scholar]
- Spite, M., Spite, F., François, P., et al. 2018, A&A, 617, A56 [NASA ADS] [CrossRef] [EDP Sciences] [Google Scholar]
- Starkenburg, E., Hill, V., Tolstoy, E., et al. 2013, A&A, 549, A88 [NASA ADS] [CrossRef] [EDP Sciences] [Google Scholar]
- Starkenburg, E., Aguado, D. S., Bonifacio, P., et al. 2018, MNRAS, 481, 3838 [NASA ADS] [CrossRef] [Google Scholar]
- Susmitha, A., Koch, A., & Sivarani, T. 2017, A&A, 606, A112 [NASA ADS] [CrossRef] [EDP Sciences] [Google Scholar]
- Tafelmeyer, M., Jablonka, P., Hill, V., et al. 2010, A&A, 524, A58 [CrossRef] [EDP Sciences] [Google Scholar]
- Takeda, Y., Hashimoto, O., Taguchi, H., et al. 2005, PASJ, 57, 751 [NASA ADS] [Google Scholar]
- Tolstoy, E., Skúladóttir, Á., Battaglia, G., et al. 2023, A&A, 675, A49 [NASA ADS] [CrossRef] [EDP Sciences] [Google Scholar]
- Travaglio, C., Gallino, R., Arnone, E., et al. 2004, ApJ, 601, 864 [Google Scholar]
- Vanni, I., Salvadori, S., & Skúladóttir, Á. 2023a, MemSAIt, submitted [arXiv:2305.02358] [Google Scholar]
- Vanni, I., Salvadori, S., Skúladóttir, Á., Rossi, M., & Koutsouridou, I. 2023b, MNRAS, 526, 2620 [NASA ADS] [CrossRef] [Google Scholar]
- Wang, X., Cheng, C., Ge, J., et al. 2022, arXiv eprints [arXiv:2212.04476] [Google Scholar]
- Welsh, L., Cooke, R., Fumagalli, M., & Pettini, M. 2022, ApJ, 929, 158 [NASA ADS] [CrossRef] [Google Scholar]
- Welsh, L., Cooke, R., Fumagalli, M., & Pettini, M. 2023, MNRAS, 525, 527 [NASA ADS] [CrossRef] [Google Scholar]
- Yan, H., Wang, L., Ma, Z., & Hu, L. 2023, ApJ, 947, L1 [NASA ADS] [CrossRef] [Google Scholar]
- Yong, D., Norris, J. E., Bessell, M. S., et al. 2013, ApJ, 762, 26 [Google Scholar]
- Yong, D., Norris, J. E., Da Costa, G. S., et al. 2017, ApJ, 837, 176 [NASA ADS] [CrossRef] [Google Scholar]
- Zhang, H. W., Gehren, T., & Zhao, G. 2014, in Setting the scene for Gaia and LAMOST, eds. S. Feltzing, G. Zhao, N. A. Walton, & P. Whitelock, 298, 453 [Google Scholar]
All Tables
Positions, magnitudes and atmospheric parameters of the stellar sample, including references to literature work (in parenthesis when the spectrum is different from that analysed here).
All Figures
|
Fig. 1. Position on the sky (left) and location on the RGB (right) for our Sculptor stellar sample, based on Gaia DR3 (Table 2). Star symbols with labels are stars with new spectra, which are analysed for the first time here; whereas, large blue circles are stars with available literature spectra, which are re-analysed here. Small, light blue points are stars from Gaia eDR3 within a 1.5 deg radius of the centre of Sculptor. |
| In the text | |
|
Fig. 2. X-shooter spectrum for the CEMP-no star in our sample, DR20080 (red), at [Fe/H] = −3. For a fair comparison, the X-shooter spectrum of PJ07402 at the same [Fe/H] = −3 is also shown in blue (Starkenburg et al. 2013). However, for the full chemical abundance analysis of PJ07402, here we use a HR UVES spectrum from Jablonka et al. (2015). |
| In the text | |
|
Fig. 3. Spectrum of AS0039 (black), showing lines of Mg I (left) and Ca I (right). Red shows the best fit, blue is ±0.4 from that, and grey shows synthetic spectra without the elements in question. |
| In the text | |
|
Fig. 4. Spectra of the strong resonance Mn I triplet for the three most metal-poor stars in our sample, [Fe/H] ≈ −3.85. |
| In the text | |
|
Fig. 5. Abundance ratios of [C/Fe] with log g in Sculptor (blue), the Milky Way (grey), and UFDs (yellow), as measured (top panel), and after applying corrections for internal mixing (bottom panel) according to Placco et al. (2014). Two green lines in the top panel note the predicted evolutionary track of [C/Fe] in stars born with [C/Fe] = +0.7, and 0, repeated with dotted lines in the bottom panel for visual aid. Milky Way data are from Roederer et al. (2014), and the UFD references are listed in Sect. 5. |
| In the text | |
|
Fig. 6. Abundance ratios of [C/Fe] with [Fe/H] in Sculptor (blue symbols), the Milky Way (grey squares) and UFDs (yellow stars), corrected for internal mixing (Placco et al. 2014), excluding CEMP-s stars. References for the Milky Way and UFDs are listed in Sect. 5. |
| In the text | |
|
Fig. 7. Light odd elements, [Na/Fe] and [Al/Fe] with [Fe/H] for Sculptor (blue), the Milky Way (grey), and UFDs (yellow). Star symbols represent the Sculptor stars analysed using new spectra, while blue circles are the stars that are re-analysed on archival spectra. |
| In the text | |
|
Fig. 8. Abundances of the α-elements, [Mg/Fe], [Si/Fe], and [Ca/Fe], along with [Ti/Fe], with [Fe/H] for Sculptor (blue), the Milky Way (grey), and UFDs (yellow). Star symbols represent the Sculptor stars analysed here using new spectra, while blue circles are the stars that are re-analysed on archival spectra. |
| In the text | |
|
Fig. 9. Iron-peak elements Sc, Cr, Mn, Co, Ni, and Zn relative to Fe, as a function of [Fe/H] for Sculptor (blue), the Milky Way (grey), and UFDs (yellow). Star symbols represent the Sculptor stars analysed here using new spectra, while blue circles are the stars that are re-analysed on archival spectra. |
| In the text | |
|
Fig. 10. Abundance ratios of the neutron-capture elements in Sculptor (blue), the Milky Way (grey), and UFDs (yellow): [Sr/Fe] (left) and [Ba/Fe] (middle) as a function of [Fe/H], and [Sr/Ba] (right) as a function of [Ba/H]. For reference, the [Sr/Ba] value of the r-process-enhanced star CS 22892-052 (Sneden et al. 2003) is noted with a green dashed line. Star symbols represent the Sculptor stars analysed here using new spectra, while blue circles are the stars that are re-analysed on archival spectra. Milky Way data come from Roederer et al. (2014), and UFD references are listed in the beginning of Sect. 5. |
| In the text | |
|
Fig. 11. Average abundance pattern at −4 ≤ [Fe/H] ≤ −2.7 in Sculptor (blue), the Milky Way (grey), and UFDs (yellow), with the error of the mean, σ/ |
| In the text | |
|
Fig. 12. Comparison between the measured chemical abundance pattern, [X/Fe], of the star AS0039 (red) in LTE (squares) and NLTE (stars) with model predictions (lines) for the pure descendants of a Pop III 20 M⊙ star with fixed mixing fmix = 0.063. Different colours denote different SN explosion energies for Pop III stars: 0.3 × 1051 erg (blue), 1.2 × 1051 erg (green), 5 × 1051 erg (yellow), and 10 × 1051 erg (orange). |
| In the text | |
|
Fig. 13. Comparison of the observed abundances of AS0039 (NLTE) to theoretical predictions for pure descendants of Pop III stars, varying their SN explosion energy, mixed fraction, and initial mass. In the upper panel, we fixed the initial mass to 20 M⊙, and, in the lower panel, we fixed the mixed fraction to fmix = 0.063. Best fits are magenta, while the worst fits, with χ2 ≥ 5 (i.e. ≥5 times the minimum), are shown with a red colour. |
| In the text | |
|
Fig. 14. Density maps of the [C/Fe] with respect to [Fe/H] as predicted by our model for the descendants of Pop III stars (shaded areas) and measured abundances (LTE) of stars in Sculptor (blue circles), Sextans (medium-blue hexagons), Carina (light-blue hexagons), Fornax (purple pentagons), the UFDs (yellow triangles), and the Milky Way (grey squares). All measured [C/Fe] abundances have been corrected for internal mixing (Placco et al. 2014). The black arrow shows the expected size and direction of how measured stellar abundances are expected to change because of NLTE effects in [Fe/H]. The shaded areas are coloured depending on the type of stars that polluted the descendants: 100% of the Pop III low-energy SNe (grey, ESN < 1.5 × 1051 erg), 100% of the Pop III hypernovae (red, ESN > 5.0 × 1051 erg), 50% of the low-energy Pop III SNe, and 50% of the core-collapse Pop II SNe (green). The densest areas (and most probable abundances) are coloured with darker shades. In all cases, fmix = 0.063. References for the Milky Way and UFDs are listed in Sect. 5. The data of dSph galaxies are from Tafelmeyer et al. (2010), and from Lucchesi et al. (2020, 2023). |
| In the text | |
Current usage metrics show cumulative count of Article Views (full-text article views including HTML views, PDF and ePub downloads, according to the available data) and Abstracts Views on Vision4Press platform.
Data correspond to usage on the plateform after 2015. The current usage metrics is available 48-96 hours after online publication and is updated daily on week days.
Initial download of the metrics may take a while.