Fig. 4
Download original image
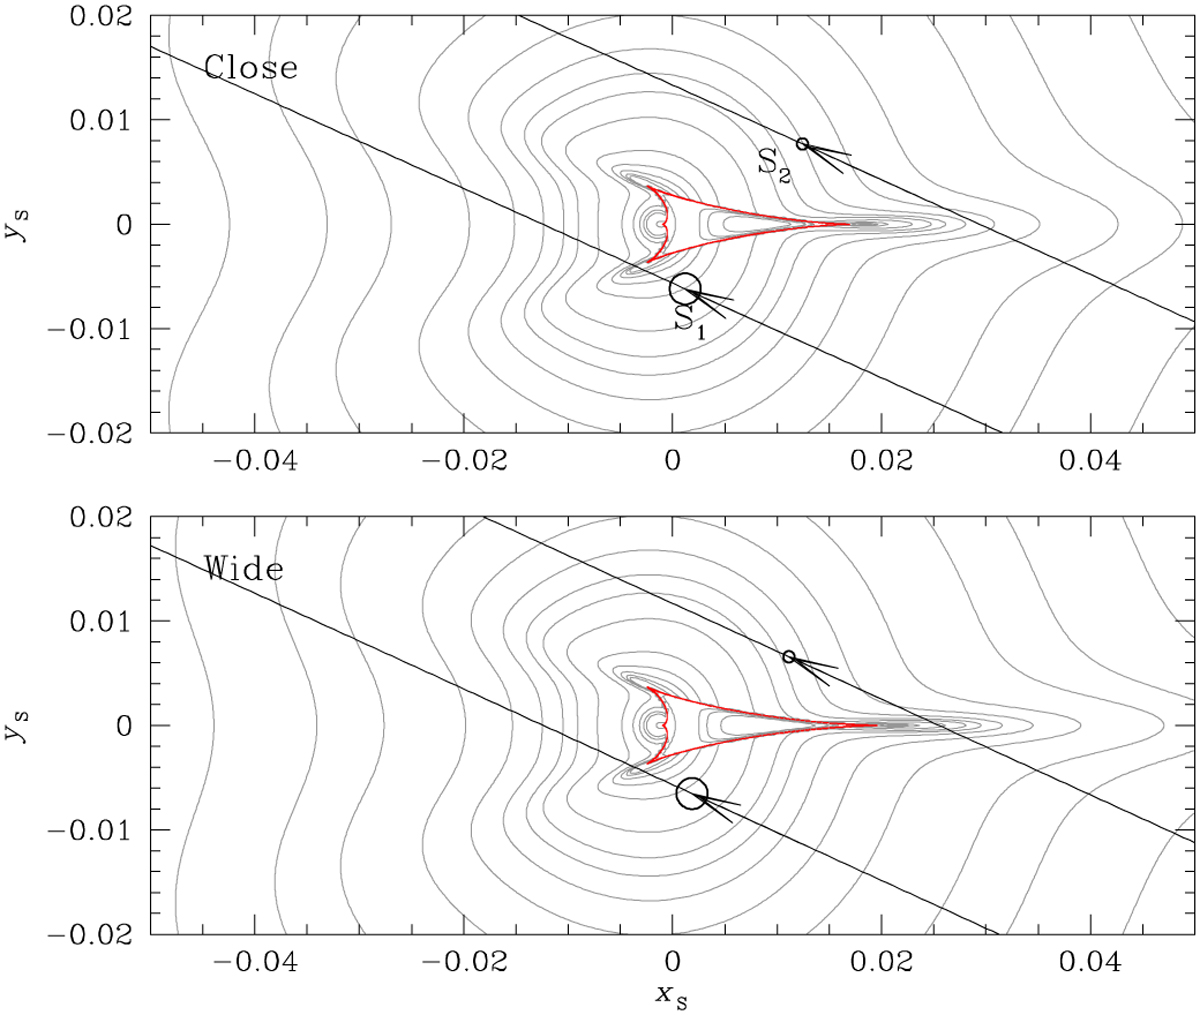
Lens-system configurations of the close and wide 2L2S solutions. In each panel, the red figure is the caustic, and the lines with arrows represent the trajectories of the primary (labeled “S1”) and secondary (“S2”) source stars. The small empty circles on the source trajectories indicate the scaled sizes of the source stars. Gray curves encompassing the caustic represent equi-magnification contours.
Current usage metrics show cumulative count of Article Views (full-text article views including HTML views, PDF and ePub downloads, according to the available data) and Abstracts Views on Vision4Press platform.
Data correspond to usage on the plateform after 2015. The current usage metrics is available 48-96 hours after online publication and is updated daily on week days.
Initial download of the metrics may take a while.