Fig. 3
Download original image
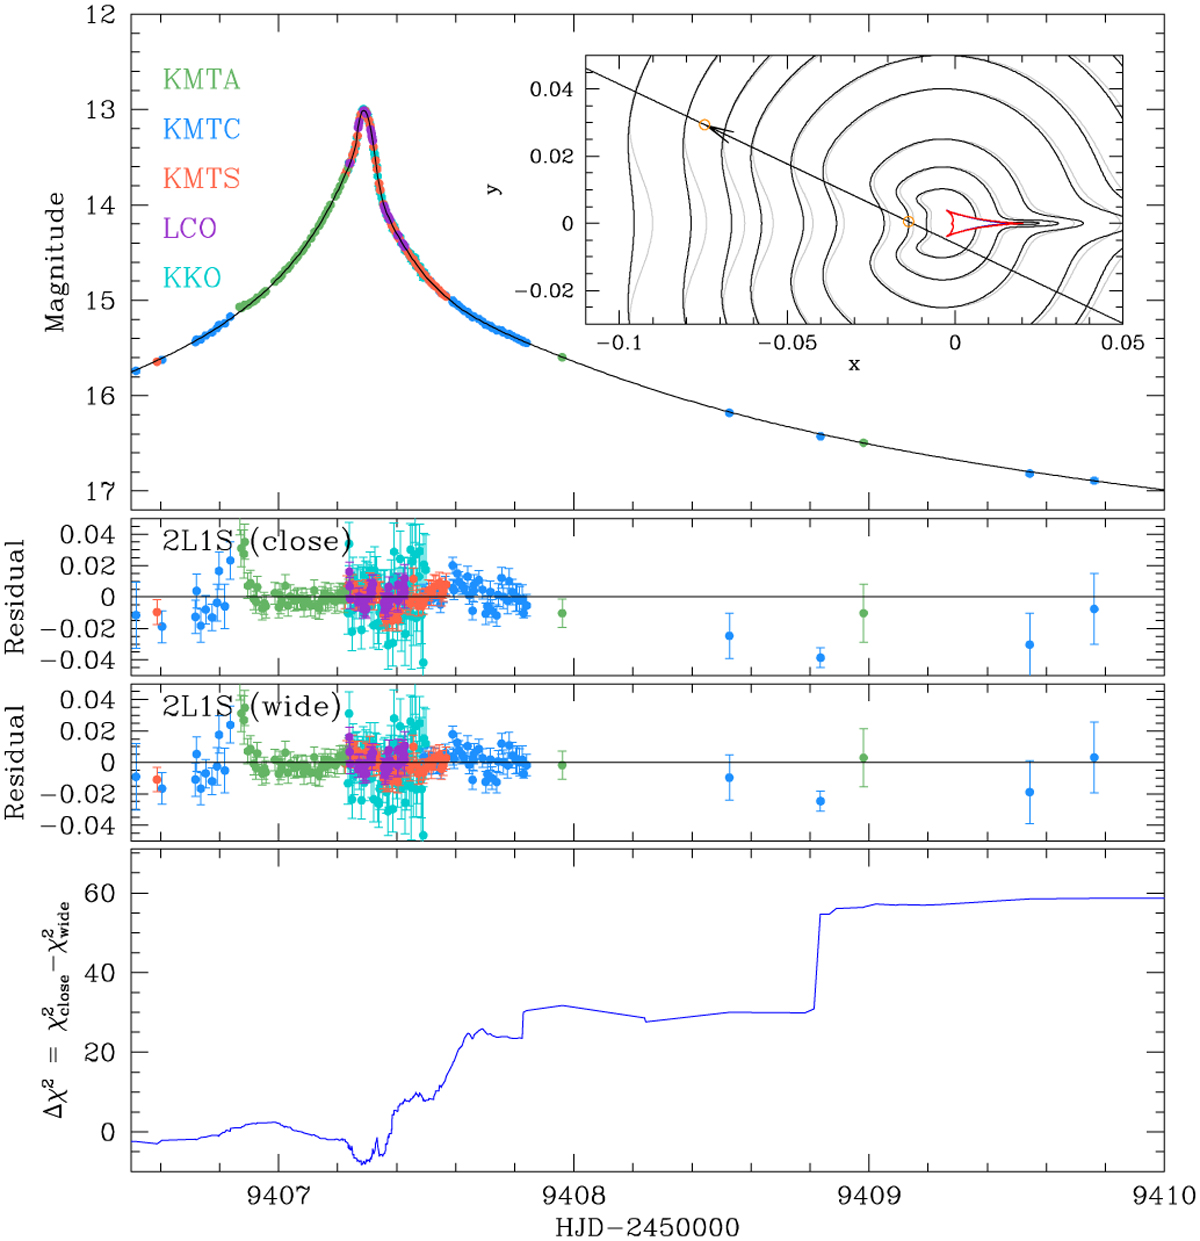
Cumulative diagram of ![]() between the close and wide 2L1S solutions (bottom panel). The top panel shows the light curve in the same time range, and the two middle panels are the residuals from the two solutions. The inset in the top panel shows the contour maps of lensing magnifications for the close (gray contours) and wide solutions (black contours).
between the close and wide 2L1S solutions (bottom panel). The top panel shows the light curve in the same time range, and the two middle panels are the residuals from the two solutions. The inset in the top panel shows the contour maps of lensing magnifications for the close (gray contours) and wide solutions (black contours).
Current usage metrics show cumulative count of Article Views (full-text article views including HTML views, PDF and ePub downloads, according to the available data) and Abstracts Views on Vision4Press platform.
Data correspond to usage on the plateform after 2015. The current usage metrics is available 48-96 hours after online publication and is updated daily on week days.
Initial download of the metrics may take a while.