Fig. 1
Download original image
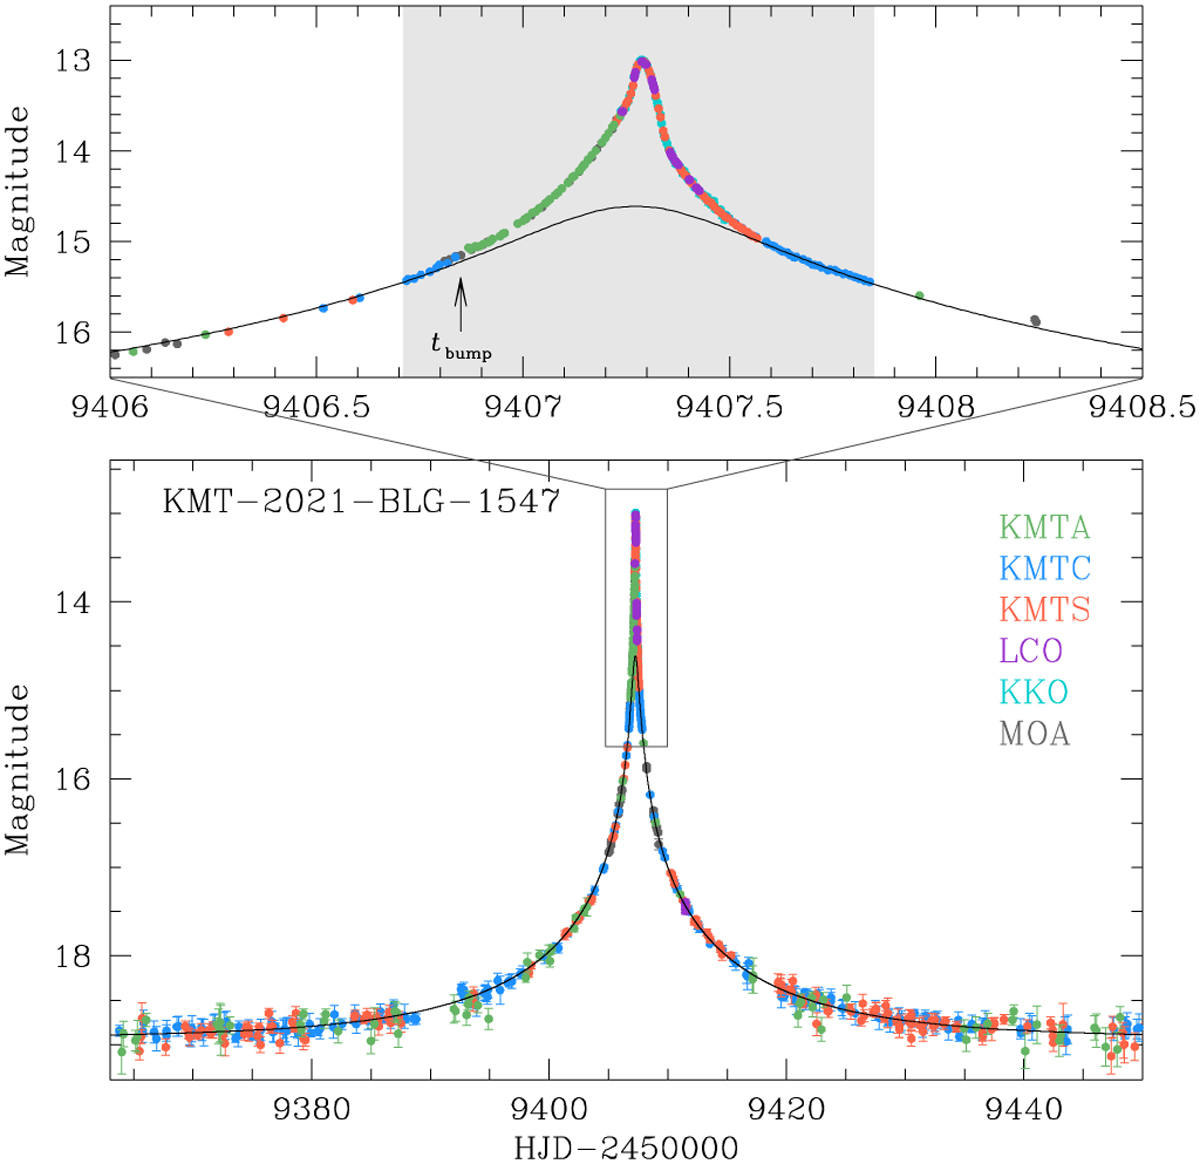
Light curve of the microlensing event KMT-2021-BLG-1547. The lower and upper panels show the whole view and a zoomed-in view around the anomalous region near the peak, respectively. The solid curve drawn over the data point is a 1L1S model obtained by excluding the data around the anomaly region of the light curve. The shaded region in the upper panel represents the duration of intensive observations, and the arrow indicates the position of a weak bump.
Current usage metrics show cumulative count of Article Views (full-text article views including HTML views, PDF and ePub downloads, according to the available data) and Abstracts Views on Vision4Press platform.
Data correspond to usage on the plateform after 2015. The current usage metrics is available 48-96 hours after online publication and is updated daily on week days.
Initial download of the metrics may take a while.