| Issue |
A&A
Volume 678, October 2023
|
|
|---|---|---|
| Article Number | A113 | |
| Number of page(s) | 22 | |
| Section | Planets and planetary systems | |
| DOI | https://doi.org/10.1051/0004-6361/202347178 | |
| Published online | 13 October 2023 | |
Oort Cloud comets discovered far from the Sun
1
Centrum Badań Kosmicznych Polskiej Akademii Nauk (CBK PAN),
Bartycka 18A,
00-716
Warszawa, Poland
e-mail: mkr@cbk.waw.pl
2
Department of Space Studies, Southwest Research Institute,
1050 Walnut St., Suite 300,
Boulder, CO
80302, USA
e-mail: luke@boulder.swri.edu
Received:
14
June
2023
Accepted:
29
July
2023
Context. Increasingly, Oort Cloud comets are being discovered at great distances from the Sun and tracked over ever wider ranges of heliocentric distances as observational equipment improves.
Aims. Our goal is to investigate in detail how the original semimajor axis for near-parabolic comets depends on the selected data arc and the assumed form of the nongravitational (NG) acceleration.
Methods. Among currently known Oort Cloud comets with large perihelion distances (q > 3 au), we selected 32 objects observed over the widest ranges of heliocentric distances in orbital legs before and after perihelion. For each of them, we determined a series of orbits using at least three basic types of datasets selected from available positional data (pre- and post-perihelion data and the entire dataset), and a few forms of NG acceleration representing water ice or CO sublimation.
Results. We find that the motion of comets is often measurably affected by NG forces at heliocentric distances beyond 5 au from the Sun. The most spectacular example is C/2010 U3 (Boattini), whose perihelion distance is 8.44 au. NG effects are detectable for 19 of the 32 comets within the positional data. For five comets, we find asymmetric effects of NG forces – in three cases significantly greater before perihelion than afterward (C/2017 M4, C/2000 SV75, and C/2015 O1), and in two others the opposite (C/1997 BA6 and C/2006 S3). We also find that the well-known systematic effect of finding more tightly bound original orbits when including the NG acceleration than in purely gravitational solutions may be related to the specific form of the standard g(r) function describing the sublimation of ices.
Key words: Oort Cloud / comets: general
© The Authors 2023
 Open Access article, published by EDP Sciences, under the terms of the Creative Commons Attribution License (https://creativecommons.org/licenses/by/4.0), which permits unrestricted use, distribution, and reproduction in any medium, provided the original work is properly cited.
This article is published in open access under the Subscribe to Open model. Subscribe to A&A to support open access publication.
1 Introduction
Near-parabolic comets are increasingly discovered beyond Jupiter’s orbit and even past the orbits of Saturn and Uranus. We already have some spectacular examples of these distant comets, such as C/2006 S3 (LONEOS), C/2010 U3 (Boattini), C/2014 UN271 (Bernardinelli-Bernstein), and C/2017 K2 (Pan-STARRS). The Oort Cloud comets discovered or seen in prediscovery images before 2022 at heliocentric distances of more than 10 au are listed in Table 1. Four comets stand out on this list because they are outside the orbit of Uranus (~19 au) in their prediscovery images (Col. 4 in the table).
Of these comets, only two, C/2001 Q4 (NEAT) and C/2017 K2, have perihelion distances q < 3.1 au. C/2017 K2 is unique in this group of long-period comets (LPCs) due to its large heliocentric distance at the time of first detection (see Fig. 5 in Królikowska & Dybczyński 2019 and Fig. 1 in Meech et al. 2017); it passed perihelion in December 2022. Recently, Yang et al. (2021) detected carbon monoxide (CO) gas from this comet at 6.7 au from the Sun. Supervolatiles such as CO and CO2 have long been proposed to drive the activity of some distant comets (Meech & Svoren 2004; Harrington Pinto et al. 2022), and CO-driven activity is possible in principle even beyond 100 au (Bouziani & Jewitt 2022). Yang et al. (2021) estimated that the outgassing from C/2017 K2 is about an order of magni- tude smaller than the CO production rate observed in C/1995 O1 (Hale-Bopp) at similar distances; readers can refer to their Fig. 3 and Womack et al. (2017, 2021).
Among LPCs with smaller semimajor axes, a spectacu- lar example of a comet with a long data arc is C/1995 O1 Hale-Bopp, discovered in July 1995 7.1 au from the Sun. Its orig- inal semimajor axis was about 260 au, while the comet is leaving the planetary zone on an orbit with a semimajor axis of about 180 au (Marsden 1997). One prediscovery observation from April 1993, when the comet was 13.1 au from the Sun, was found. At the Minor Planet Center, more than 3000 positional mea- surements for Hale-Bopp are listed. Hale-Bopp was observed in August 2013 34.6 au from the Sun, outside Neptune’s orbit, and by JWST in July 2022 at 46.2 au (Kelley et al. 2022), making it the only comet imaged well beyond Neptune’s orbit. Szabó et al. (2012) found that Hale-Bopp only stopped being active when it was about 28 au from the Sun, some 11 yr past perihelion.
Starting in 2025, the Vera C. Rubin Observatory is scheduled to carry out a 10-yr program called the Legacy Survey of Space and Time (LSST; Ivezić et al. 2019). One of LSST’s four science themes is to take an inventory of small bodies in the Solar Sys- tem (Schwamb et al. 2023), including long-period comets, in six filters, with single-exposure limiting magnitudes of r ~ 24.4 and co-added limiting magnitudes of r ~ 27.5. Silsbee & Tremaine (2016) estimate that LSST will discover hundreds to thousands of bodies from the Oort Cloud with q > 5 au, even if they do not display cometary activity. Given that some comets are active at q ≫ 5 au, LSST may find even more distant comets than Silsbee & Tremaine (2016) predict.
One of the main goals of this study is to determine how the value of the original semimajor axis aori depends on the data-arc selection used for the orbit determination. Three main types of data arcs were tested for each comet: complete arcs, pre-perihelion arcs, and post-perihelion arcs. This is an important issue, as even tiny changes in the eccentricity of the near-parabolic orbit can cause significant, systematic changes in the semimajor axis. These systematic changes interfere with the estimates of the position of the maximum of the original 1/a dis- tribution even where we might expect nongravitational (NG) acceleration to be quite negligible.
The dependence of aori on the data arc can only be studied using the longest data arcs available. Therefore, we selected objects observed for long intervals before and after perihelion passage, enabling us to determine high-quality orbits based on a complete data arc, as well as with observations taken only before or after perihelion. We chose Oort Cloud comets with original semimajor axes of more than 10000 au according to a gravita- tional model of motion. We also considered comet C/2016 N4 (MASTER) because its aphelion distance is ≈ 10 000 au (Sects. 2 and 7).
Another important objective of this study is to investigate the NG effects in the orbits of LPCs with large perihelion distances. Squires & Beard (1961) and Marsden et al. (1973) pointed out that there is a systematic difference between gravitational (GR) and NG orbits for long-period comets. Marsden et al. (1973) cal- culated GR and NG orbits for five LPCs with 0.3 au ≲ q ≲ 1.2 au, and found that in general, NG fits gave more tightly bound orbits. They also stated that the explanation for this systematic effect “is not obvious”. Królikowska (2001) calculated NG orbits for 16 LPCs with 0.2 au ≲ q ≲ 2.4 au for which GR orbit fits gave hyperbolic original orbits (that is, 1/aori < 0). In every case, 1/aori increased when NG effects were accounted for. Fourteen of the orbits changed from hyperbolic to elliptical, while the other two remained hyperbolic at the ≈ 2σ level.
Marsden et al. (1973) introduced the “g(r)” functional form (Eq. (1)) for how the magnitude of NG forces depends on distance r from the Sun (see Sect. 3). Most studies that have cal- culated NG orbits for comets, including orbital databases such as the Minor Planet Center1 (MPC) and the JPL Small-Body Database Browser2 (JPL) and Królikowska (2001) have used this equation, which is a fit to a simple energy balance model for a spherical nucleus (Delsemme & Miller 1971). For very small r,  , while far from the Sun, g(r) falls much more rapidly with increasing distance. However, the distance r0 at which the transition between these two regimes takes place depends upon which gas is the driver of activity and the rotation state of the cometary nucleus (see Sect. 3).
The only comet for which we have in situ data for an extended time (more than 2 yr) is the target of the Rosetta mission, the Jupiter-family comet 67P/Churyumov–Gerasimenko. For this comet, the water production rate  from r ≈ 4 au to per- ihelion at 1.24 au and
  after perihelion (Hansen et al. 2016; Farnocchia et al. 2021). In the model of Marsden et al. (1973), the magnitude of NG forces should be nearly propor- tional to the gas production rate (Kramer & Läuter 2019). Comet 67P has two main lobes, connected by a “neck,” and an obliq- uity of 52° (Jorda et al. 2016). As a result of its large obliquity, the comet spends most of its 6.4-yr orbit in northern summer. Southern summer lasts less than a year, but perihelion passage occurs within this time. Most of the comet’s mass loss occurs during this brief period. Attree et al. (2019) invoke the removal of a mantle from 67P’s southern hemisphere to explain the steep trend of Q(r) versus r. At least for this comet, modeling sea- sonal effects is crucial to reconcile the different dependencies of g(r) and Q(r) with r (also see Davidsson et al. 2022; Attree et al. 2023).
Unfortunately, we do not have a resolved image of the nucleus, much less a shape model, for any long-period comet, and we only know the spin states of a few LPCs (Knight et al. 2023). C/1996 B2 (Hyakutake), an LPC with aori ≈ 660 au, has an obliquity of 108° and, similar to 67P, has asymmetric rates of gas and dust production around perihelion due to seasonal effects (Schleicher & Woodney 2003). Even for Hale-Bopp, the best-observed LPC, the orientation of the spin axis is uncertain (Jorda & Gutiérrez 2002).
Marschall et al. (2020) note that seasons and the shape of the nucleus play major roles in determining how cometary activity varies with distance from the Sun. We therefore must take an individualized approach to modeling NG forces.
Modeling the NG acceleration adjusted individually to both the comet’s astrometric data and observations of its activ- ity is currently possible only for a particular group of LPCs, such as the near-parabolic comet C/2002 T7 (LINEAR; q = 0.62 au; Królikowska et al. 2012), where we have not only long sequences of positional data but also numerous measurements of the water production rates (Combi et al. 2009). Modeling the NG motion using the dedicated g(r) form is especially pos- sible in active comets that are bright enough for the Solar Wind ANisotropies (SWAN) all-sky hydrogen Lyman-α camera on the SOlar and Heliosphere Observer (SOHO) satellite to detect and image at H Lyα to calculate water production rates. Many of these comets have perihelia well below 1 au from the Sun, making them susceptible to partial or complete disintegra- tion, such as the three comets studied by Combi et al. (2023). From 1996, when the bright comet C/1996 B2 (Hyakutake) was intensively observed, to 2021, SWAN studied about 50 LPCs (Combi et al. 2019, 2021); however, all have perihelion distances below 2 au, and about half are near-parabolic (Oort Cloud) comets.
A long data arc covering a wide range of heliocentric dis- tances increases the chance of detecting NG effects in large perihelion LPCs active beyond 5 au, for which the sublimation of CO or CO2 can be suspected as the main driver of their activ- ity (Meech & Svoren 2004; Harrington Pinto et al. 2022). In this aspect, it is partly a continuation of research undertaken in Królikowska & Dybczyński (2017, hereafter KD17). In this paper, we use the Marsden et al. (1973) formulation for NG effects, but we note issues with the model’s parameters, especially for CO-driven activity (Sect. 3).
This study also focuses on estimating how the original semi- major axes of comets depend on the assumed form of comet activity with heliocentric distance. We demonstrate what the dif- ferences can be by applying a variety of simple models of activity for the studied comets (Sects. 4–6).
In the case of Oort Cloud comets with large perihelion dis- tances studied here, one would expect that the NG effects would have a small or negligible impact on the orbit determination, including the value of the original 1/a obtained using the posi- tional data. In many cases, we find a surprisingly large effect on the derived value of 1/aori, as we discuss in Sect. 7. Section 8 summarizes all aspects of this investigation.
Oort Cloud comets discovered before 2022 more than 10 au from the Sun or with prediscovery detections beyond 10 au.
2 Samples of long-period comets
There are now quite a few comets observed for several years from a heliocentric distance of at least 7 au prior to perihelion passage to a similar distance after perihelion. From this group, we selected 32 LPCs whose perihelion distances exceed 3.1 au and whose data arcs are within the broadest heliocentric distance ranges possible (relative to perihelion distance). Three were dis- covered closer to the Sun than 7 au: C/1999 H3 (LINEAR), C/2000 SV74 (LINEAR), and C/2013 G3 (Pan-STARRS); read- ers can refer to Table 2.
C/1980 E1 (Bowell) is the only comet in Table 2 discov- ered before 1990. It suffered such strong planetary perturbations (mainly due to an approach to within 0.228 au of Jupiter) that it is leaving our Solar System on a fast hyperbolic trajectory (υ∞ ≈ 3.8 km s−1). At present, only 1I/’Oumuamua and 2IVBorisov have faster trajectories. The other five objects were discovered in the last decade of the 20th century, the rest only in the 21st cen- tury. This statistic reflects the increased ability to detect comets farther and farther from the Sun.
Table 2 shows these objects, which we divided into three groups as follows. Sample LAn consists of 11 comets with 3.1 au < q < 3.9 au that exhibit NG effects in the orbital fits to the positional data. Most of these objects were described in KD17 and Królikowska & Dybczyński (2020, hereafter KD20; also see the CODE catalog3). For C/2017 M4 (ATLAS), the NG orbits were determined in this study. Sample LBn includes eight comets with q > 4.5 au that also demonstrate NG effects in the orbital motion; five comets from this sample have NG orbits obtained in this investigation (C/2005 L3, C/2009 F4, C/2010 U3, C/2013 V4, C/2015 H2). Sample LBg includes 13 comets with q > 4.5 au for which the NG effects cannot be determined or are highly uncertain.
Table 2 also shows that for almost all the comets in our sam- ples, data start at heliocentric distances greater than 7 au; for comets C/2006 S3 (LONEOS) and C/2010 U3 (Boattini), predis- covery observations were made well beyond the orbit of Uranus, and for C/2014 UN271, beyond the orbit of Neptune. Likewise, all but two of these comets have been tracked after perihelion to heliocentric distances beyond 7 au. In some comets with mod- erate perihelion distances (sample LAn), the heliocentric range of the data arc is narrower; however, they also have a relatively long data arc on both legs of their orbits. The only exception is comet C/1999 H3 (LINEAR), which has a short data arc before perihelion (about 4 months). This comet and two others with fewer than 100 pre-perihelion measurements (C/1980 E1 and C/2000 CT54 (LINEAR) in Table 2) will serve as examples of objects with pre-perihelion-based orbits of poorer quality than the orbits of the other comets analyzed here. (The uncertain- ties of 1/aori,pre,GR are represented by the light blue solutions in Fig. 7.) Despite this, the full-data-based GR orbits are of the highest quality for all these comets. Almost all are Oort spike comets according to their GR solutions (aori,full,GR > 10000 au); the exception is C/2016 N4, which has an original semimajor axis of about 6000 au.
Throughout this paper, 1/aori means the original recipro- cal of the semimajor axis and is given at a distance of 250au from the Sun, at which planetary perturbations are negligible (KD17, Sect. 6). KD17 also describe the method for calculating the uncertainties of 1/a and other orbital elements. The other indices given in 1/aori specify the type of data arc taken for orbit determination (for example, “pre” denotes pre-perihelion data) and the type of model of motion (GR, NG).
Twelve of the comets studied here were identified in predis-covery images, often by routine sky surveys. Such comets can be seen by comparing the date encoded in the comet’s name to the date of the first observation (given in Col. 3 of Table 2). Such early positional detection can potentially be used to verify NG accelerations in the motion of comets with large perihelion distances.
Analyzed sample of large-perihelion LPCs with long data arcs; three samples are listed in order of increasing q.
3 Orbital solutions
We not only attempted to use a complete data arc, but also to determine the GR and NG orbits of all comets considered here using data before perihelion (pre-perihelion data; in short: PRE) and after perihelion (post-perihelion data, POST), separately. The model of motion and the methods used for orbit determi- nation are described in KD17 (and references therein), while the expressions we assume for the nongravitational acceleration are described below. Thanks to the long data arcs, we were able to accurately determine GR orbits for the PRE and POST data separately for all the comets we studied.
The Oort spike comet sample analyzed in KD17 included 16 comets with determinable NG orbits. We reconsider eight of these here because they have long data arcs and separate orbits for both orbital legs were previously not determined: C/1980 E1, C/1997 BA6, C/1999 H3, C/2000 CT54, C/2000 SV74, 2005 EL173, C/2006 S3, and C/2008 FK75; for C/2006 S3, the data arc is about 4 yr longer than we had previously. In all, we study 19 comets with NG effects, which form two sub-samples: LAn (3.1 au < q < 3.9 au, 11 comets) and LBn (q > 4.5 au, 8 comets); see Sect. 2 and Table 2. The sample of large-perihelion (q > 3.1 au) Oort spike comets with determinable NG orbits thus now includes 27 objects.
For all the comets with NG orbits, we noticed some decrease of the RMS error of the fit and reduction of trends in Observed Minus Calculated [O–C] time variations when the NG model of motion was used for orbit determination. KD17 and Królikowska (2020) have detailed discussions of this issue.
Comparison of original 1/a between different orbital sources (Sample LBg).
3.1 Purely gravitational orbits. Comparison of original 1/a with other sources
To highlight what differences can be expected for 1/aori due to the use of different methods for orbit determination from the positional data, including the data treatment (their selection and weighting), we compare the values we determine or were previ- ously reported in the CODE catalog with three other well-known orbital sources: the MPC, JPL and Nakano Notes4. To make this comparison, we chose comets from Sample LBg, for which we have GR orbits from all these sources. We try to have orbits deter- mined on the basis of data arcs as similar as possible. That is, we take the most recent orbit given in each source except for three comets taken from the MPC (marked by asterisks in Table 3). For those comets, we use the second orbit given in the MPC database because its value of 1/aori is consistent with other MPC solutions for those comets, but completely different from the 1/aori value of the first solution. We do not know the cause of this discrep- ancy. The data were retrieved from these three orbital databases between 14 and 19 July 2023.
The MPC and Nakano Notes list values of 1/aori together with osculating orbital elements. To obtain 1/aori for orbits given by JPL, we used the JPL Horizons Web Application5.
Table 3 shows that our values of 1/aori are very close to JPL’s values. These differences never exceed 2.5au−6, and are usually smaller6. The same is true for comparisons between our values and MPC, or MPC and JPL for almost all comets except one of three mentioned above (C/2015 XY1). These differences are mainly due to the data treatment – the different criteria used for data selection and whether weighting is applied to the data. For example, using a slightly different data treatment, we obtain 1/aori = 66.83 ± 1.62 au−6 for C/1999 N4 and 40.98 ± 0.50 au−6 for C/2012 LP26. How the data arc and the data treatment can change the 1/aori estimates can be also seen by looking at the MPC database, where in most cases a series of orbital solutions are given for each comet. For example, for C/2017 E3, six of eight values of 1/aori given by the MPC for orbits obtained using different data arcs are in the range of 38–42 au−6. Using a pre-perihelion data arc, we obtained a value of 42.92 ± 1.04 au−6. Below, we show that the differences in 1/aori can be 10 au−6 or even larger when we use only the pre-perihelion data arc for this sample of comets.
We have noticed that the values of 1/aori reported in the Nakano Notes are systematically lower by about 10 au−6 than the values from other sources. Ito & Higuchi (2020) find a sim- ilar result, and suggest that the discrepancy might result from assuming different planetary masses, while Ito (2021) compares 1/aori values in the CODE catalog, JPL, and the MPC.
In this paper, when comparing the 1/a values for the studied comets, we mainly refer to those tabulated by the MPC. At JPL, these values are not given explicitly, but must be calculated by setting the date for each comet to three or four centuries ago.
3.2 Nongravitational orbits
To determine a cometary NG orbit in the region well inside the planetary zone, as in KD17, we applied a standard formalism proposed by Marsden et al. (1973, MSY), where three orbital components of the NG acceleration acting on a comet are pro- portional to the g(r)-function, which is symmetric relative to perihelion,
![$\matrix{ {{F_i} = {A_{\rm{i}}}\,g\left( r \right),} \hfill & {{A_{\rm{i}}} = {\rm{constant}}\,\,\,\,{\rm{for}}\,\,\,\,\,i = 1,2,3,} \hfill \cr {} \hfill & {\,\,\,\,g\left( r \right) = \alpha {{\left( {{r \mathord{\left/ {\vphantom {r {{r_0}}}} \right. \kern-\nulldelimiterspace} {{r_0}}}} \right)}^{ - m}}{{\left[ {1 + {{\left( {{r \mathord{\left/ {\vphantom {r {{r_0}}}} \right. \kern-\nulldelimiterspace} {{r_0}}}} \right)}^n}} \right]}^{ - k}},} \hfill \cr }$](/articles/aa/full_html/2023/10/aa47178-23/aa47178-23-eq4.png) (1)
(1)
where F1, F2, and F3 represent radial, transverse, and normal components of the NG acceleration, respectively, and the radial acceleration is defined as positive outward along the Sun-comet line. This study uses three types of the g(r)-function defined above; their parameters are given in Table 4.
The coefficient α is determined by the condition g(1 au) = 1. The values of r0 for isothermal water-ice sublimation and CO sublimation have a simple interpretation, as they represent the approximate distance at which gas production rates are only 10−3 of the rates at 1 au (to be precise, g(r) = 10−3 at r ≈ 3.1 au and 10.9 au, respectively). The value of r0 ≈ 50 au for subsolar water sublimation from HJ17 does not have the same significance. In this case, g(r) = 10−3 at ≈ 5.7 au. One should not attach special importance to the large values of r0 and k given in HJ17 and used here. A similar very sharp cutoff for g(r) in Fig. 1 can be obtained for many values of r0 and k.
Table 4 shows that these g(r)-like functions differ in the values of the exponents m, n, and k, but most importantly, on the heliocentric distance range of the effective action of the NG acceleration, which is mainly controlled by the r0 parameter (Sekanina & Kracht 2017; Sekanina 2021). The standard form of the g(r) function given by MSY, which we call NG-std (Table 4), is widely used to calculate the NG accelerations in comets and is shown in Fig. 1 using the red curve. Therefore, we applied this formula here to compare our results directly with calculations in the literature. For models involving water-ice sublimation, we use the canonical value of r0 = 2.808 au from Marsden et al. (1973) for a (roughly) isothermal nucleus (Hui & Jewitt 2017). For CO ice sublimation, we assume r0 = 10 au (as the basic CO form), and r0 = 50 au (for comparisons), and employ the same exponents m = 2, n = 3, and k = 2.6 used by JPL instead of the Yabushita (1996) function used in Królikowska (2004). The Yabushita (1996) formula takes the form:
 (2)
(2)
and is shown in Fig. 1 using the cyan curve. The g(r)-like func- tion with r0 = 10 au we use (blue curve in the figure) is very similar in shape to Yabushita’s function; however, our curve has a knee at a larger heliocentric distance than does Yabushita’s formula or the g(r)-like formula used by JPL (r0 = 5 au). More than 30 yr ago, Sekanina (1992) argued that the knee is far out- side the planetary zone when assuming sublimation by CO from the subsolar point (r0 > 100 au, his Fig. 3 and Table I; also see Meech & Svoren 2004; Sekanina & Kracht 2017, their Table 16 and Figs. 9 and 10; Ye et al. 2020, footnote 13; and Bouziani & Jewitt 2022). Thus, the formula used here with the knee at 10 au is a conservative estimate of the outer limit of cometary activity. Furthermore, strong observational evidence has recently emerged that some comets are active at the outskirts of the planetary zone (Hui et al. 2019; Jewitt et al. 2021; Bouziani & Jewitt 2022). We subsequently show that assuming r0 = 10 au (for CO sublimation) can give significantly different results for original semimajor axes than the standard g(r) formula for water sublimation.
The standard g(r) formula should only be treated as an approximation of the actual momentum-transfer law in comets due to water-ice sublimation. Recently, Hui & Jewitt (2017, HJ17) discussed a general approach to sublimation of a water ice comet nucleus and determined three sets of parameters with isothermal, hemispherical, and subsolar sublimation models, respectively (also see Cowan & A’Hearn 1979)7. HJ17’s g(r)-like function for isothermal sublimation is very similar to that given by MSY (the lines almost overlap in the plot, so we only show the curve representing the g(r)-std formula). We decided to use the MSY formula for the isothermal nucleus and HJ17 for the subsolar sublimation of water ice (red and magenta solid lines in the figure). The latter is similar for distances up to ~5au to the form found by Sekanina (1988) for subsolar sublimation of water ice; see Fig. 1. The difference between these two curves (magenta and dotted magenta) at large heliocentric distances is due to the different model assumptions of HJ17 and Sekanina (1988). For the formula representing the sublimation of CO, we used the third and fourth sets of NG parameters given in Part A of Table 4. As we already mentioned, this function differs from the CO formula used in the JPL Database Browser by assuming r0 = 10 au or larger instead of 5 au. Such a selection of g(r)- like functions to study the NG orbits is necessary because, to date, experience with modeling different sets of parameters for g(r) (Królikowska 2004; Królikowska et al. 2012) indicates that the best sensitivity to the quality of NG orbit fitting to positional data can be found when testing different values of r0. Figure 1 shows that r0 defines the heliocentric distance of a knee in the g(r)-like curve (see Fig. 1, Królikowska 2004, and KD17). In the cases of the magenta and blue curves with r0 = 5 and 10 au, these knees are within the observation area (light gray band in the figure). However, for the standard g(r) function, this knee is less than 3 au from the Sun, therefore outside the gray area. Also, for r0 = 50 au, the knee is outside the data area, beyond its right edge. The different knee positions also result in sub- stantially different slopes of g(r)-like curves within the region covered by observations.
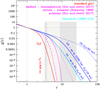 |
Fig. 1 Comparison of the g(r)-like formulas used in this study and given in the literature; logarithmic scales are used on both axes and r is in au. The gray rectangle shows the range of heliocentric distances covered by all positional measurements used in this study (32 sets of data), while the light gray rectangle shows the range for C/2015 O1, chosen as a typical example for Sample LAn (see Table 2). |
3.3 Some remarks on orbit fitting assuming CO- or H2O-driven activity
CO ice is more volatile than water ice and is widely believed to be an important driver of the activity in comets at large helio- centric distances (particularly beyond Saturn’s orbit; Bockelée-Morvan et al. 2004; A’Hearn et al. 2012; Fulle et al. 2020; Yang et al. 2021). However, for comets with moderate perihelion dis- tances (3.1 au < q < 4.5 au, LAn sample), we try three forms of g(r)-like functions (MSY; HJ17; and CO sublimation with r0 = 10 au) to compare the quality of the fits to the positional data (see below). For comets with q > 4.5 au (samples LBn and LBg), we only applied the g(r)-like function which describes the sublimation driven by CO to NG orbit determination.
In general, the relative uncertainties of the NG parame- ters obtained from the CO-driven g(r)-like formula are much smaller than those obtained from the standard formula for comets observed at the heliocentric distances analyzed here. The same is true for the g(r)-like function given by HJ17 for subsolar water sublimation. It seems to be a natural consequence of the much greater r0 used for the CO-driven and subsolar g(r)-like for- mulas because the NG acceleration then operates efficiently at much greater distances from the Sun (within a longer part of the data arc) than in the case of the standard g(r)-like formula with r0 = 2.808 au (Fig. 1).
For comets with q > 3 au, the position of the knee of the standard form of the g(r) function is closer to the Sun than their perihelion distances. Typical values of the parameters A1, A2, and A3 for these comets are in the range of 10−6–10−4 au day−2. For the other forms of g(r) (for which the knee is much further from the Sun), the inferred values of A1, A2, and A3 are much smaller for the same comets. Their typical values range from 10−9 to 10−7 au day−2. However, in all cases the NG accelera- tions at perihelion (A · g(q), where  are within the range 10−3–10−5 of the solar gravitational acceleration F⊙(r).
Two of the analyzed comets, C/2006 S3 and C/2010 U3, were discovered much more than 10 au from the Sun. Therefore, for these two comets, we also test intermediate values of r0 between 10 au and 50 au for CO sublimation (Sects. 5.5 and 6.3).
4 Sample LAn
As we mentioned in the previous section, for comets having per- ihelion distances between 3.1 au and 4.5 au, we fit three basic forms of the g(r)-like function described in Part A of Table 4 to the complete data arc, as well as to the PRE and POST legs of their orbits, independently. However, we tested the formula with r0 = 50 au for only four comets from this sample (C/2017 M4, C/2000 SV74, C/2015 O1 and C/2005 EL173).
Sample LAn contains six comets discovered before 2010. Their NG orbits based on complete data arcs were considered in KD17. For the five remaining objects (discovered after 2010), the NG orbits are given in the CODE catalog; however, longer data arcs are now (as of July 2023) available for three of them (C/2016 N4, C/2017 M4, C/2015 O1). The NG orbits obtained for all of these comets using the full data arcs show a reduction in the RMS and a better time distribution of the residuals of the [O–C] diagram compared to the GR orbits; see Col. 3 of Table 5. The most spectacular RMS decreases in the NG solutions were observed for C/2017 M4, C/2000 SV74, and C/2015 O1; these are discussed in more detail below. NG orbits based on the CO-driven formula obtained by Yabushita (1996) are available in the Nakano Notes for all three comets, as well as for C/1997 BA6. The expression used by Nakano is Eq. (4.4) of Yabushita (1996; in different units) and is given in Eq. (2) in the previous sec- tion and is shown in Fig. 1 with a cyan curve. The NG orbit of C/2015 O1 is also given at the MPC. JPL offers NG orbits for C/2017 M4 and C/2015 O1. Both sources and the Nakano Notes use different forms of a g(r)-like function8. It is also worth high- lighting the strong NG effects in the positional data of comet C/2012 F3, which were previously discussed in Wysoczańska et al. (2020, also in the CODE catalog); those orbits based on the complete set of data are also used here. The weakest evi- dence of NG effects was found in the positional data of comet C/2005 EL173.
Table 5 also shows that it was possible to obtain independent NG solutions for the PRE or POST data arcs in half of the cases, but only for four comets for all forms of g(r) on both orbital legs. This table shows that the RMS values for NG solutions (water-ice sublimation and CO-driven) obtained using the full data arcs (Col. 3), as well as those based on PRE and POST data arcs (Cols. 5 and 7), are very similar. Moreover, for some comets with NG solutions determinable for all three types of datasets, the preferred form of g(r) seems to be different depending on the choice of the data arc set. These facts make it difficult to draw firm conclusions.
However, considering all three types of data arcs and also time trends in residuals ([O–C]), we can say that for three comets (C/2000 CT54, C/2016 N4, and C/1999 H3), the orbit based on the standard form of water-ice sublimation gives a slightly better fit than does the CO-driven formula. In the other five cases (C/2017 M4, C/1997 BA6, C/2000 SV74, C/2015 O1, and C/2005 EL173), the NG solutions based on the sublimation of CO ice or sublimation of water ice from the subsolar point appear to fit the data better than the NG solution using the standard g(r). For the next two comets (C/2012 F3, C/2013 G3), all three types of NG solutions have RMS values within 0701 of each other.
For C/1997 BA6 and C/2015 O1, the NG orbit obtained using the subsolar water sublimation formula gives the small- est RMS of the three NG solutions considered here. In addition, NG solutions with asymmetric g(r)-like formulas (that is, with the magnitude of the NG forces peaking before or after per- ihelion) can also be obtained in the last two cases. Of these asymmetric NG solutions, the orbit assuming the sublimation of water ice from the subsolar point also gives the best fit, with RMS values of 0.″65 and 0.″46, respectively, for C/1997 BA6 and C/2015 O1.
For comets with 3.1 au ≤ q ≤ 4.5 au, activity can be driven by H2O, CO, or another volatile (Fig. 1). One might expect that hypervolatile ices like CO would be depleted in returning long-period comets, but Harrington Pinto et al. (2022) found that LPCs with aori > 10 000 au typically produce more CO2 than CO, while LPCs with aori < 10 000 au produce more CO than CO2, Womack et al. (2017, 2021) discuss this issue for the dynamically old LPC C/1995 O1 (Hale-Bopp). Harrington Pinto et al. (2022) invoke preferential loss of CO from Oort Cloud comets due to galactic cosmic rays as a possible mechanism for this trend (Strazzulla & Johnson 1991; Maggiolo et al. 2020; de Barros et al. 2022).
Thus, it seems that a CO g(r) formula should be applied if we have direct observations of the domination of CO-driven activ- ity in a specific object. Otherwise, we should try both H2O- and CO-based formulas. At the moment, we do not have an updated analysis of the dynamical status of these comets. For exam- ple, estimates in the CODE catalog should be revisited because more precise parameters for stars that passed near the Sun in the recent past have become available thanks to the Gaia Early Data Release 3 (Gaia Collaboration 2021) and Data Release 3 (Gaia Collaboration 2023); Dybczyńki & Breiter (2022) and Bailer-Jones (2022) discuss this issue further.
However, NG orbits based on the CO-driven formula used here often seem to reduce the trends in [O–C] (compared with the GR orbits) and yield smaller uncertainties for the NG param- eters than do NG orbits based on the two water-driven formulas. Moreover, the standard g(r) formula sometimes gives an unphysical negative radial component of the NG acceleration (that is, A1 < 0) for the PRE or POST orbital leg. Therefore, we ultimately decided to discuss the PRE/POST asymmetry in NG activity for C/2017 M4, C/1997 BA6, C/2000 SV74, and C/2015 O1 using NG orbits based on the CO-driven g(r)-like form, but in Sects. 4.1–4.3, we also show the asymmetry of activity for all NG solutions given in Table 5.
4.1 C/2017 M4 (ATLAS)
C/2017 M4 was observed for 4.5 yr in the heliocentric dis- tance range of 6.09–3.25 au (perihelion) −9.19 au. We were able to obtain GR and NG orbits for this comet for all three data arcs considered (Table 5); the NG parameters are presented in Table 6.
NG orbits are fit to the entire data arc, resulting in an almost twofold smaller RMS and a notable reduction of trends in [O–C] compared to the GR solution. When the PRE or POST orbital branch is separately considered, the RMS only decreases a little for the NG solutions, as the RMS for GR orbits is already very small. We observed a similarly small decrease in the RMS values between GR and NG solutions for the PRE or POST data arcs in all the other comets we considered (see Table 5).
The NG parameters obtained here based on the standard g(r) and full arc are consistent with those obtained by JPL for the same data arc (as of July 2023). JPL’s values are: A1 = 903.4 ± 21.9, A2 = 108.3 ± 24.6, and A3 = 215.8 ± 8.1 in units of 10−8 au day−2 (compare with Table 6). However, for this comet, we found that the NG solutions for the PRE and POST datasets based on g(r)-std are unphysical or uncertain. Moreover, we obtain a slightly better fit to the data when we use the other two g(r)-like formulas. For both of these NG functions, we also obtained reasonable NG parameters for the PRE and POST parts oaf the orbit separately. The level of activity measured by  is almost twice as high for the PRE branch than for the POST branch for this comet when using a g(r)-like function for CO, and about 30% higher for HJ17; see Table 6. Thus, the relative difference in NG activity depends on the assumed form of the g(r)-like function.
For this comet, we obtained different values of 1/aori, depending on the model of motion and choice of the data arc. Taking into account all GR and NG orbits9 obtained here and based on the PRE and entire data arcs, we found values of 1/aori between 14 au−6 and 56 au−6; each of the 1/aori values has a small uncertainty of at most 2 au−6. Such a small uncertainty for individual solutions is the result of the highest quality of all of these orbits. The NG solution given by the Nakano Notes (NK4608) gives a value of 1/aori = 31 au−6, whereas the GR orbit presented by the Minor Planet Center (MPC) gives 39 au−6 (data arc only through March 20, 2020).
We also tested the CO formula for g(r) with r0 = 50 au for this comet. This formula gives the same RMS within 0701 as the CO formula with r0 = 10 au and small differences in [O–C] with no explicit improvement for all three types of data arcs (entire dataset, PRE, and POST). However, for the PRE dataset the transverse NG parameter, A2, is uncertain due to its small value and the original 1/a is negative (see Sect. 7).
4.2 C/2000 SV74 (LINEAR)
C/2000 SV74 was observed for 4.7 yr in the heliocentric dis- tance range of 6.26–3.54au (perihelion)_9.51 au; prediscovery observations extend the data arc by 19 days (see Table 2). The CODE catalog10 shows a significant decrease in RMS for the NG orbit and a notable reduction of trends in [O–C] compared to the GR solution.
Figure 2 compares the NG solution (based on the CO-driven g(r)-like formula) obtained using the complete data arc (with a slightly different weighting of observations than in the CODE catalog, hence there are tiny differences with the NG solution given in the catalog; see Table 7) to the NG solution provided by the Nakano Notes (NK1258) using the formula of Yabushita (1996). The residuals taken from the Nakano Notes are shown in the bottom panels of Fig. 2. It seems that there are no fundamen- tal differences in the fits for both NG solutions using different forms of the expressions of the nongravitational force for ices more volatile than H2O, except for the first and last oppositions for this comet. Perhaps the CO formula we use in this study is a little better in both these oppositions, but doubts remain about the quality of these fits. A satisfactory pattern of residuals for the first and last oppositions can be easily obtained by fitting two independent NG orbits to the PRE and POST data and apply- ing any of the three g(r)-like formulas used here. Moreover, NG solutions based on the CO-driven and subsolar water sub- limation formulas give RMS values for both orbital legs a bit smaller than does the standard g(r) formula (Table 5).
Table 7 compares solutions based on HJ17 and CO sublima- tion; however, the NG solutions using HJ17 give slightly worse RMS values for each of the three data arcs than does CO, and thus is not listed in Table 5. They are shown here to indicate sim- ilar relations between the NG parameters on the PRE and POST orbital legs. For the NG solution based on CO sublimation, the level of activity before perihelion is almost twice as large as after perihelion, when the asymmetry is measured by comparing the values of A (Sect. 4.1). For the NG solution based on the sub- solar water sublimation model, activity is about 2.5 times larger before perihelion than after perihelion and is even larger for the standard form of g(r); however, this last form gives a worse fit to positional data for each set of data (full, PRE, POST).
For this comet, we obtained different values of 1/aori, depending on the model of motion and choice of which orbit is the most reliable. Considering GR and NG orbits obtained here (based on PRE and complete data arcs), we conclude that the value of 1/aori is between 48 au−6 and 91 au−6; each of the 1/aori values has a small uncertainty of at most 2 au−6.
Unfortunately, we obtained a similarly wide range of 1/aori values for NG orbits because 1/aori strongly depends on the adopted g(r)-like formula for this comet. However, if we decide that NG orbits based on the CO-driven formula are the most reli- able, we get a range from 51 au−6 to 68 au−6, and this spread of 1/aori values is mainly due to the use of different data arcs (full and PRE); the NG solution in NK 1258 gives a value of 1/aori = 74 au−6.
As for C/2017 M4, we also tested the CO formula with r0 = 50 au. This r0 gives a slightly smaller RMS of about 0/01, com- pared with the CO formula with r0 = 10 au for the POST dataset. However, no important differences in [O–C] were noticed for all three types of data arcs (entire dataset, PRE, and POST); also see Sect. 7.
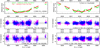 |
Fig. 2 Comets C/2000 SV74 (LINEAR; left column) and C/2015 O1 Pan-STARRS (right column). Upper panels: time distribution of positional observations with corresponding heliocentric (red curve) and geocentric (green curve) distances at which they were taken. The horizontal dotted line shows the perihelion distance for a given comet, whereas the vertical dotted line shows the moment of perihelion passage. Middle panels: [O–C]-diagrams for the NG orbit based on the CO-driven g(r)-like function and obtained using the full data arc, where residuals in right ascension are shown using magenta dots and in declination by blue open circles; gray horizontal bands around zero indicate the RMS level. Bottom panels: [O–C]-diagrams using residuals available at the Nakano Notes Database and obtained using the Yabushita (1996) form of the CO-driven g(r)-like function. |
4.3 C/2015 O1 (Pan-STARRS) and a remark about C/1997 BA6 (Spacewatch)
Solutions discussed here for C/2015 O1 are based on a data arc spanning 4.8 yr in the heliocentric distance range of 8.65-3.73 au (perihelion) – 7.28 au (2020 March 20); prediscovery measure- ments extend the data arc by almost 2 months (Table 2). The comet is still observable; at the beginning of 2023, it is 13.4 au from the Sun, moving outward about 2 au yr−1.
As with C/2000 SV74, orbit fits for C/2015 O1 show a signif- icant decrease in RMS for three types of NG orbits (Table 5) and a much better residual distribution in the [O–C]-diagram com- pared to the GR solution. However, the standard NG orbit gives a slightly worse fit to data than the two other types of NG formulas for all three data arcs (full, PRE and POST).
Table 5 presents two sets of solutions for this comet that differ in the data treatments. The first row contains the results based on data selected and weighted during orbit determina- tion, and the second row represents the same data, but with all points equally weighted. This is a common example of how data treatment affects the fitting of various NG models to the data. Regardless of whether the data were weighted or not, it appears that the NG solution based on the HJ17 expression gives the best solution for the entire data arc. However, the [O–C]-diagram for this NG solution has small trends in residuals like those of the NG solution presented in Fig. 2 (right column, middle panel). Therefore, neither these tiny differences in the RMS nor the dif- ferences in the [O–C] diagrams allow for a clear choice between the subsolar water sublimation (HJ17) and CO-driven g(r)-like formulas. The NG parameters for the chosen NG solutions are given in Table 6.
In addition, Fig. 2 shows that two different CO-driven for- mulas (here using weighted data and in the Nakano Notes) give similar quality fits, and the apparent differences may be mainly due to the use of different selection and data weighting procedures in the Nakano Notes and here.
The GR orbits (weighted data) determined using PRE and POST data arcs independently give RMS values of 0736 and 0754 for similar numbers of observations before and after per- ihelion (1904 and 2260, respectively). At first sight, this suggests a perfectly suitable GR orbit for the data arc before perihelion compared to the GR orbit for POST data. However, the [O–C] diagram reveals some tendencies in the residuals in the GR orbit using the full PRE dataset. These discrepancies occur mainly for the first two oppositions, that is, for heliocentric distances >5.5 au. If we exclude those measurements, we find a GR orbit for the PRE data with no visible trends in the [O–C] diagram. However, the NG orbit using the CO-driven formula (or subsolar formula of HJ17) and the entire PRE data gives an RMS drop of only 0701 (weighted data) and no trends in the [O–C]-diagram.
In the case of the POST data arc, we obtained an NG orbit with satisfactorily well-determined NG parameters A1, A2, and A3 (the RMS decreased by 0701). However, there is no distinct preference of the residual distribution in the [O–C]-diagram for the NG orbit compared to the GR orbit.
The original 1/a values of all orbits obtained in the study for C/2015 O1 (and those discussed below) were between 15 au−6 and 55 au−6, and the uncertainty of 1/aori in each orbit was small, as for C/2000 SV74 (less than 2 au−6). It is worth noting the different 1/aori values obtained for all three NG solutions. How- ever, the orbital solutions based on the CO-driven formula give 1/aori values ranging from 15 to 35 au−6, depending on the data arc used. The Nakano value of 22 au-6 is well inside this range. The 1/aori value of (34 ± 2) au−6 was obtained for the GR solu- tion using part of the PRE data (heliocentric distances greater than 5.5 au). All this leads to the conclusion that the preferred orbits for determining the origin of this comet are either the GR orbit using part of the PRE data arc (mentioned above) or NG orbits based on the PRE data arc (sublimation of water ice from the subsolar point or CO-driven sublimation). The original 1/a values of these three orbits are between 28 and 38 au−6.
For this comet, we also determined the four NG parameters for the asymmetric g(r(t – τ))-like function, where τ is the time shift of maximum g(r) relative to perihelion passage. We found that this shift (that is, the time of peak NG forces) is about 80–110 days before perihelion, depending on the assumed g(r)-like form. The RMS decrease is at the level of 0702. The direction of this shift is in line with significantly larger NG parameters for PRE data than for POST data, see Table 6. Similarly, for C/1997 BA6, we also were able to obtain NG orbits for both orbital legs, as well as the NG model with a τ shift. In this case, the time shift was after perihelion by about 130–140 days for all three NG models of motion. This shift is also consistent with smaller NG parameter values for PRE than POST data, see Table 6.
We also tested the CO formula with r0 = 50 au and found no differences in RMS and [O–C] compared to r0 = 10 au, but the A2 parameters for PRE and POST data are small, with values comparable to their uncertainties. Thus, only NG parameters for the entire data arc are well-determined. However, this last solu- tion results in a negative value of the original 1/a (similarly as for the PRE solution based on the same g(r) for C/2014 M4); see Sect. 7.
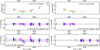 |
Fig. 3 Cornet C/2015 H2 Pan-STARRS. The left column shows the [O–C] diagrams for GR and NG solutions based on the full data arc, while the right column displays [O–C] diagrams for two different GR solutions based on pre-perihelion and post-perihelion data arcs, respectively. |
5 Sample LBn, comets with new fits for nongravitational effects
Comets in this sample have perihelia ranging from 4.5 au to 8.4 au from the Sun. Thus, their NG orbits were determined solely based on CO-driven sublimation.
Below, we discuss the five comets with NG orbits determined in this study (marked by asterisks in Col. 1 in Table 2). All except C/2009 F4 have prediscovery measurements. The Minor Planet Center and the Nakano Notes only offer GR orbits for these five comets, whereas the JPL Small-Body Database Browser presents an NG orbit for one of these objects (for C/2015 H2 Pan-STARRS, as of July 2023).
For all comets from this sample, we also tested the CO for- mula with r0 = 50 au (Table 5). However, in this section, we decided to discuss only NG solutions with r0 = 10 au. The reason is that, as we indicated in the previous section for three comets (C/2017 M4, C/2000 SV74, and C/2015 Ol), this form of g(r) with r0 = 50 au often gives less reliable solutions; in particu- lar, the transverse NG parameter can be much smaller than for r0 = 10 au and poorly determined (with uncertainties as large as the values). However, it is worth noting that the CO type of g(r) with r0 = 50 au typically results in much smaller values of original 1/a; also see Sect. 7.
5.1 C/2015 H2 (Pan-STARRS)
Comet C/2015 H2 was discovered on 2015 April 24, when it was 6.28 au from the Sun and about 1.4 yr before its perihelion pas- sage. Prediscovery images found for this comet expand the data arc by 11 months. Thus, the heliocentric distance range covered by data is 7.96–4.97 au (perihelion)–9.52 au during a period of 5.4 yr; see Table 2.
The CODE catalog currently shows a GR orbit based on the data arc until 2017 November 22. The data arc is now about 2 yr longer, as the comet was observed until 2019 October 22. The MPC presents a GR orbit based on data from 2014 May 19 to 2019 September 3, while JPL offers an NG orbit using the same data arc we use (as of July 2023).
This is a unique example that demonstrates very strong evi- dence of NG effects in the comet motion in the LBn sample. However, the analysis of NG effects shows atypical behavior along the orbit, as we describe below.
First, we were able to obtain well-fitted GR solutions with no firm evidence of trends in residuals for the PRE and POST data arcs separately (see Table 5 and the right column of Fig. 3). In addition, we obtained NG orbits for the PRE and POST data arcs, but the NG parameters are uncertain, and the reductions of RMS are tiny. Therefore, these orbits are not presented in Tables 5 and 8.
Second, the GR orbit based on the complete data arc exhibits notable residual trends, as we show in the bottom left panel in Fig. 3. Moreover, the NG orbit based on the complete data arc gives a spectacular decrease of RMS from 0.“72 to 0.″34 with no trends in residuals and well-determined radial and normal components, but a worse-defined transverse component of NG acceleration (Tables 5 and 8, and the middle left panel in Fig. 3). It is the largest relative RMS reduction of the orbital fits for comets in the LBn sample.
GR and NG orbits based on the full data arc give values of the original 1/a of 22.6 ±1.0 and 34.6 ± 2.0 au_6, respec- tively, whereas the GR orbit based on the PRE data arc gives a much larger value of 46.4 ± 1.3au−6. A very similar tendency to find smaller values of l/aori as the comet’s data arc becomes longer can be seen in all the solutions given by the MPC; how- ever, we note that they provide only GR solutions. JPL presents an NG orbit based on the entire data arc and using a CO-driven function with r0 = 5 au for which the transverse component is determined with even worse accuracy than here. This is proba- bly a consequence of the smaller value of r0 assumed in the JPL fit (see Sect. 3.2).
NG parameters A1; A2, and A3 (in units of 10−8 au·day−2) for the NG orbits described in Table 5 for five comets from the sample LBn (CO sublimation) for which the NG effects are not given in the CODE catalog; uncertainties in the NG parameters are listed on the lines below each set of values.
5.2 C/2013 V4 (Catalina)
Comet C/2013 V4 was discovered on 2013 November 9, less than a year before its perihelion. Prediscovery images expand the data arc by about 16 days. This comet was observed for 4.8 yr until 2018 August 6 in the heliocentric distance range of 7.32−5.19 au (perihelion)−8.99 au; see Table 2.
The CODE catalog offers only a GR orbit based on the entire data arc as of July 2023, and this orbit is used here. How- ever, the NG orbit based on the complete data arc leads to a satisfactory pattern of residuals in the [O–C]-diagram, where almost all trends disappear, and the RMS is reduced by about 0.″03 compared to the GR orbit (Table 5). This NG solution gives well-determined radial and transverse components of the NG accelerations by assuming a normal component of zero (Table 8). Likewise, there are no trends in GR orbits obtained independently for the PRE and POST data arcs. We were not able to obtain NG orbits for the PRE and POST data arcs.
GR and NG orbits based on the entire data arc give consis- tent values of the original 1/a of 79.2 ± 0.2 and 79.6 ± 0.8 au−6, respectively, whereas the GR orbit using the PRE data arc gives a slightly larger value (84.1 ± 0.5 au−6). Values of 79.4 and 68 au−6 for the original 1/a are given by the MPC and the Nakano Notes (NK 4294) for GR orbits, respectively.
5.3 C/2009 F4 (McNaught)
Comet C/2009 F4 was observed for 6.4 yr during seven oppo- sitions in the heliocentric distance range of 8.96−5.45 au (perihelion)−10.55 au; see Table 2. At the end of the data arc, there is a 6-month break with no observations, and then only two measurements (on 2015 August 20) are available. Of the last two, only one measurement in right ascension can be fit well to the orbit determined using the POST data arc. However, both measurements are completely rejected in the GR and NG orbits using the complete data arc (only the GR orbit is given in the CODE catalog as of July 2023). Because of this issue with the final two data points, we list two sets of data for this comet in Table 2.
The right column of Fig. 4 shows the difference between the data fit to the GR orbit (bottom panel) and the NG orbit based on the g(r) function for CO sublimation. Here, the last two obser- vations are rejected. Thus, both orbits were obtained using a half-year shorter data arc (see the second row in Table 2 for C/2009 F4). The RMS reduction of the NG orbit compared to the GR orbit is more than 10% (from 0.″54 to 0.″48) and the NG parameters are formally well-defined (Table 8). In addition, the time trends in the [O–C] diagram are smaller, particularly around perihelion from early 2011 to mid-2012. JPL and Nakano provide GR orbits using the same data arc through February 2015, while the MPC orbits are also GR-type and are given both with and without the August 2015 observations.
Orbits obtained separately using the PRE and POST data arcs provide interesting results. Fits to both GR solutions (PRE and POST) to the respective data are shown in the left column in Fig. 4. The much larger residual scatter after perihelion can be due to several factors, including an increase in comet activ- ity from various regions of the rotating nucleus. We describe a similar RMS increase after perihelion for comet C/2015 O1 in Sect. 4.3.
The GR orbit fitted to the PRE data (618 observations) gives an RMS of 0.″33. This GR solution already gives a much bet- ter fit than is obtained for NG solutions based on a full data arc; compare the middle panel of the left column in Fig. 4 to the middle panel of the right column. In addition, we obtain an NG orbit with well-determined uncertainties for the radial and normal components of the NG acceleration, but the transverse component is poorly determined; the RMS decreases by only ~0.″01, but the time trends in the [O–C] diagram are reduced.
The situation is quite different for the POST data arc. Here, the RMS of the GR orbit is 0.″60 (595 observations; the two August 2015 measurements are almost completely rejected), which is twice as large as for the PRE data arc. Furthermore, it is impossible to reasonably determine an NG orbit with the POST data arc, even if both observations from August 2015 are completely rejected.
GR and NG orbits based on the complete data arc through February 2015 result in original 1/a values of 40.6 ± 0.3 and 44.3 ± 0.7 au−6, respectively, whereas GR and NG orbits based on the PRE data arc give slightly larger 1/aori values (49.9 ± 0.5 and 46.3 ± 1.0 au−6). The PRE orbits seem best suited for studying the origin of this comet. The GR solutions in the MPC and Nakano Notes give 46.3 and 31 au−6 for 1/aori, respectively.
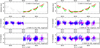 |
Fig. 4 Cornet C/2009 F4 McNaught. Upper panels: time distribution of positional observations. Lower panels: O–C diagrams for selected orbital solutions described in the text; for the meaning of the lines and symbols, see Fig. 2. |
5.4 C/2005 13 (McNaught)
Solutions obtained in this study are based on data spanning 9.5 yr in the heliocentric distance range of 10.3–5.59 au (perihelion)-14.93 au; two series of four prediscovery detections extend the data arc by about 10.5 months (see Table 2). The CODE catalog gives only a GR orbit as of July 2023, using a data arc more than a year shorter than that available now. Now, NG effects are quite well-determined using the longer data arc and a g(r)-like function reflecting CO sublimation; however, the RMS decreases only by 0701 compared to the GR orbit (see Tables 5 and 8). No reliable NG orbit can be obtained based on the 3.4-yr PRE data arc.
GR orbits based on the full data arc and PRE data give consistent values of the original 1/a of about 61.7 ± 0.1 and 62.1 ± 0.6 au−6, respectively, whereas the NG orbit based on the full data arc gives a slightly larger value (68.4 ± 0.7au−6). The Minor Planet Center and the Nakano Notes list GR orbits with 1/aori of 61.25 and 51 au_6, respectively.
5.5 C/2010 U3 (Boattini)
C/2010 U3 was discovered on 2010 October 31, but sev- eral prediscovery images extended the data arc back to 2005 November 5, when the comet was 27.75 au from the Sun. At the moment of discovery, it was more than 8 yr before its perihelion passage and 18.4 au from the Sun. This comet passed perihe- lion on 2019 February 26 at a distance of 8.45 au from the Sun and was still observed in April 202311. Hui et al. (2019) indicate that this comet was active in late 2005 when it was well out- side Uranus’s orbit (at ~26 au from the Sun). They examined the pre-perihelion data arc from November 2005 to December 2018; the authors found many of the prediscovery measurements by using the Solar System Object Image Search service (Gwyn et al. 2012)12. Assuming a pure GR model of motion, Hui et al. (2019) concluded that over half the measurements (984 of the total of 1723 positional observations, RMS = 0.″41) should be rejected due to poor internal consistency. Using their GR orbit, Hui et al. (2019) studied its dynamical evolution and calculated that the comet passed its previous perihelion at a dis- tance of 8.364 ± 0.004 au from the Sun approximately 1.96 Myr ago. Thus, they concluded that this comet was a dynamically old member of the Oort Cloud. Their model includes galactic tides, but not perturbations by passing stars during the 2-Myr period covered by their dynamical calculations. However, some stars may strongly perturb the motion of Oort Cloud comets during this time. Some examples of the strongest stellar perturbers are given in Dybczyński & Breiter (2022), Dybczyński & Królikowska (2022), and Bailer-Jones (2022). For this reason, the estimation that C/2010 U3 is a dynamically old comet by Hui et al. (2019) requires recalculation with the new set of stars men- tioned in the articles cited above. Hui et al. (2019) also attempted to determine an NG orbit using the same dataset described above and found that the NG orbit is defined marginally (the uncertain- ties of the three NG parameters are comparable to their values; see Table 3 therein) and did not improve the orbital fits.
The CODE catalog currently (as of July 2023) includes two GR orbital solutions with their [O–C]-diagrams. The first orbit is based mainly on pre-perihelion data spanning 14.25 yr in the heliocentric distance range of 25.75–8.45 au (perihelion)– 8.68 au (2020 February 3, solution “b5”, 2144 observations, RMS = 0.″58). This solution gives systematic deviations in right ascension (positive values) and declination (negative values) for all 11 prediscovery measurements and some tiny trends in part of the data. The second orbit (solution “p5”) is obtained using part of the PRE data arc and consists of measurements taken at heliocentric distances greater than 14.88 au (data until 2013 February 8). This last solution provides a good fit to the data arc, showing the high quality of the prediscovery dataset (solution “p5” in the CODE catalog, 206 observations, RMS = 0.″53).
The GR orbit fit to the dataset for the latter case and traces of a trend in residuals for the GR orbit obtained using the observations until about 2 yr after perihelion passage suggest the existence of NG effects in the positional data, despite the comet’s large perihelion distance. Data spanning 15.4 yr (observations until 2021 April 18) allow us to conclude that an NG orbit can be marginally determined using the available data arc (Table 2), with the radial and transverse components of the NG accelera- tion at significance levels of 2σ and 4σ, respectively (Table 8). However, the [O–C] diagram for this NG orbit based on the full data arc (lowest panel in the left column in Fig. 5) still shows trends in residuals like those for the GR orbit based on the same data arc. The NG parameters based only on the PRE data are somewhat more reliable (Table 8). However, the GR orbit based on the 9.28 yr data arc until mid-February 2015 (361 observa- tions, RMS = 0.″49) seems to fit the data better than the NG orbit obtained using the complete data arc (2481 observations, RMS = 0.″58; also see Table 2), because the shorter arc shows no trends in residuals (compare the middle panel with the bottom one in the left column in Fig. 5).
Therefore, we conclude that C/2010 U3 is the comet with the largest perihelion distance for which NG accelerations seem to be detectable using positional measurements in the period 2005 November – 2021 March (Table 5). Additionally, the NG orbit obtained with the CO formula shows a trend in the residuals (as in the case of the GR orbit), which already occurs in the PRE data at heliocentric distances between 10 and 11 au. Unfortunately, using a larger value of r0 (15, 20, 30 or 50 au) does not improve the fit to the data.
To examine the possible existence of NG forces and 1/aori changes within the pre-perihelion leg of C/2010 U3’s orbit more carefully, a series of GR orbits using increasingly longer data arcs was obtained, starting from the orbit with one opposition more than that given in the CODE catalog (solution “p5”, data arc until early 2013). Each of the following three GR orbits was obtained using a data arc with one opposition more than the previous one, that is, using data through early 2014, 2015, and 2016; see Table 9 and the upper left panel in Fig. 5. Here, eleven precise prediscovery observations obtained in 2005 and 2006 at Mauna Kea Observatory are perfect for finding traces of systematic trends (which we identify with the existence of NG acceleration in the comet motion) in this series of solu- tions. A tendency toward clearly decreasing relative weights for these 11 prediscovery measurements as the data arc lengthens is easy to see, starting from a level several times better than the mean weight of observations to about half of this mean (Col. 3 of Table 9; the weighting procedure is described in detail in Królikowska et al. 2009). Moreover, for the last orbit of this series (data until April 2016), a trend in residuals was also visible: all residuals in right ascension were positive, and in declination, negative; a similar tendency can be seen for the NG solution discussed earlier (bottom left panel in Fig. 5). From the analysis of this series of solutions, we conclude that the orbit based on the longest data arc, not yet showing NG effects, is the one obtained using the data arc from 2005 November 5 to 2015 February 15 (middle left panel in Fig. 5), which included five oppositions after the discovery of C/2010 U3 in 2010 (mid- dle solution in Table 9). It means that tiny traces of NG effects start to appear in the positional data when this comet was beyond 11 au from the Sun.
All GR and NG orbits obtained in this study (based on differ- ent data arcs) give very similar values of the original semimajor axes between 55 and 65 au−6. However, the preferred starting orbit for dynamical studies of the comet’s past evolution is the orbit based on the PRE data arc up to 2015 February 15, which has 1/aori = 59.1 ± 1.0 au−6.
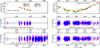 |
Fig. 5 Comets C/2010 U3 Boattini (left column) and C/2013 V4 Catalina (right column). Upper panel: time distribution of positional observations. Lower panels: O–C diagrams for selected orbital solutions described in the text; for the meaning of the lines and symbols, see Fig. 2. |
Series of GR solutions obtained for C/2010 U3 using three different sets of pre-perihelion data arcs, each starting from 2005 November 5.
6 Outline of a few other cases
This section describes three more comets from the sample LBn – C/2008 FK75 (Lemmon-Siding Spring), C/1999 U4 (Catalina- Skiff), C/2006 S3 (LONEOS), and the comet with the longest data arc of objects from the LBg sample, C/2008 S3 (Boattini). All four comets, except C/2008 FK75, have a series of prediscovery measurements. The MPC, JPL, and the Nakano Notes present NG orbits only for C/2006 S3 (LONEOS).
6.1 C/2008 FK75 (Lemmon-Siding Spring)
The data arc of C/2008 FK75 covers 5.6 yr in the heliocentric distance range of 8.24−4.51 au (perihelion)–9.51 au. The CODE catalog provides an NG orbit based on the CO-driven g(r)-like function and complete data arc. That orbit gives a better distri- bution of residuals in the [O–C] diagram, especially for the first and last oppositions, than does the GR orbit.
In this study, we successfully determined NG orbits for the PRE and POST data arcs independently. However, in the case of the POST data, only the radial component of the NG accel- eration is well-determined (Table 10). Each of the GR or NG orbits based on the PRE and POST data yields [O–C] distribu- tions of the same quality in the respective data arc as the NG orbit based on full data arcs (so obtained by assuming three constant NG parameters within the full period of observations).
Additionally, we redetermined the GR and NG orbits using the full data arc applying the data selected and weighted as for GR orbit determination using PRE and POST data, indepen- dently, and the residuals of these orbits are given in Table 5. There are only tiny differences in NG parameters between our previous results used in KD17 (first row in Table 5 for this comet; also see solutions “a6” and “c6” in the CODE catalog) and the NG orbit obtained here (first row in the table for this comet).
GR and NG orbits based on the complete data arc (redetermined here and those from KD17) result in a narrow range of original 1/a between 27.9 and 42.9 au−6. The GR orbit obtained using the PRE data gives a similar original 1/aori = 38.5 ± 0.3 au−6. However, the NG-CO solution based on PRE data suggests that this value might be as small as 17.8 au−6. GR orbital solutions presented in the MPC and the Nakano Notes give values of 29 and 18 au−6, respectively, for 1/aori.
6.2 C/1999 U4 (Catalina-Skiff)
C/1999 U4 was discovered on 1999 October 31 by the Catalina Sky Survey and, independently, on November 1 by Brian A. Skiff of the LONEOS Survey. Prediscovery detections from 1999 September 18 and October 30 were later found. The CODE cat- alog currently (July 2023) presents GR and NG orbits based on data spanning 4.6 yr in the heliocentric distance range of 7.55−4.92 au (perihelion)–8.22 au. We use the same data arc here.
Unfortunately, the NG orbits for PRE and POST data arcs are uncertain, and we do not consider them here. GR and NG orbits obtained previously (see the CODE catalog) and those calculated here using complete and PRE data arcs result in original orbits in a narrow range of original 1/a from 22 to 38 au−6. Each orbit has a small 1/aori -uncertainty of at most 3 au−6. GR orbits in the MPC and the Nakano Notes give values of 36.9 and 21 au−6 for 1/aori, respectively.
6.3 C/2006 S3 (LONEOS)
Solutions discussed here are based on a data arc spanning 18.3 yr in the heliocentric distance range of 26.14−5.13 au (perihelion)–14.64 au. Our fits include three prediscovery positional measurements from 1999 October 13, and two more from 2006 August 29 and September 17. The latter series occurred two days before the comet was discovered on 2006 September 19. At the time of discovery, C/2006 S3 was 14.3 au from the Sun. The comet passed perihelion on 2012 April 12. Photometric and spectroscopic studies of C/2006 S3 by Shi et al. (2014) and Rousselot et al. (2014) showed that this comet was very active at ≈ 6 au, producing dust at a rate like that of 29P/Schwassmann-Wachmann 1 (also see Kulyk et al. 2018).
When we performed orbit fits for this comet at the end of 2021, the data available at the MPC extended about 1.6 yr longer, until 2018 January 16, compared to our previous results (KD17, the CODE catalog). As a result, all kinds of orbits for this comet have been recalculated here. We were able to obtain an NG orbit using the entire data arc, as well as for the PRE and POST data arcs; see Table 5.
For this comet, two different NG solutions were presented at the MPC and at JPL as of July 2023. The MPC’s orbit was based on data spanning from 2006 August 29 through 2020 November 24, and JPL has a NG solution that goes from 2006 September 19 through 2020 November 24. JPL’s data arc covers the full period of positional detections since the comet’s discovery, but does not take prediscovery measurements into account.
We found that the 1999 measurements (in right ascension and declination) did not fit the orbit for the entire data arc as well as for the PRE data arc. Moreover, these 1999 data give large residuals in declination even for the orbit determined using dis- tant pre-perihelion (PRE+DIST) data. Using a larger value of r0 (15, 20, 30 or 50 au) also does not improve the PRE+DIST orbit fit of the 1999 prediscovery measurements to the data. We indi- cate this problem by including two data arcs of different lengths in Table 2.
Using the data from 1999 to 2009 December 19, in the heliocentric distance range between 26.14 au and 8.01 au, the measurements in right ascension are well-fitted to the NG orbit, while those in declination are rejected, and some traces of NG acceleration are detectable at the level of 2σ. Furthermore, the measurements in right ascension are closer to the NG orbit than they are for the GR orbit. The large residuals in declination do not seem to be improved by assuming a larger value of r0.
Figure 6 shows that a model with three constant NG parame- ters from 2006 until 2018 is not satisfactory. In particular, it still shows some wavy trends after perihelion. Introducing a fourth NG parameter, that is, a time advance or delay in the asymmet- ric g(r)-like function, does not improve this situation and does not reduce the RMS. However, we determined two NG solutions using PRE and POST data arcs (Table 8). The NG parameters of both these solutions show that the magnitude of the NG accel- eration is about 4.2 times greater for the post-perihelion leg of the orbit than for the pre-perihelion leg. This result agrees with the conclusion of Rousselot et al. (2014) that C/2006 S3 was more active after its perihelion than before (see Fig. 5 therein). Assuming constant NG parameters after perihelion still shows some time trends in the orbital fits, although they are smaller than for a model with constant NG parameters along the entire data arc. The comet may have undergone an outburst in Febru- ary 2014 at 7.16 au (Sárneczky et al. 2016), almost 2 yr after perihelion passage. Even when we limit the data arc to mid-2015, some trends are still visible in the residuals for the NG orbit. Thus, we can conclude that the comet’s activity must have changed after perihelion in 2012, but before mid-2015. It is worth noting that the MPC, in addition to the two NG orbits (the first mentioned earlier and the second covering observations up to 2016 November 29), also offers a set of GR solutions based on shorter and longer datasets, but always starting with observations from 2006 August 29.
In May 2022 we found that 16 more observations from 2018 May 16 to 2020 November 24 (heliocentric distance range 15.25–19.76 au) were available at the MPC, so we used these data to validate the above conclusion. These measurements were taken at Mauna Kea (from 2018 May 16 and 2018 June 18, obser- vatory code 568) and by the Dark Energy Survey (DES; from 2018 December 12 to 2020 November 24, observatory code W84). We constructed a series of three different data arcs, where the first included data from 2015 December 10 to 2020 November 24, and the second and third included one and two more oppositions than were used in the first dataset, respec- tively (Table 11). We fit GR orbits to these three datasets. For the first two datasets, we obtained very good GR orbit fits with no trends in relative weights and [O–C] time distribution, and no traces of NG effects. However, for the longest dataset, the GR orbit determination procedure forced systematically small relative weights starting from January 2018. An NG orbit can be determined for this last dataset, but the uncertainty of the transverse component of the NG acceleration is large. So the conclusion is that between November 2013 and November 2014, at heliocentric distances between 6.7 au and 8.6 au, C/2006 S3 still exhibited NG effects in its orbital motion, while since November 2014, they can be completely neglected. This, together with the previous conclusions, indicates the rather erratic behav- ior of this comet about 2 yr after perihelion, which coincides perfectly with the outburst event observed in this comet by Sárneczky et al. (2016).
All of these GR and NG orbits (based on different data arcs) lead to 1/aori values between slightly negative (for example, the NG orbit using the PRE dataset gives −0.49 ± 2.61 au−6) and about 20 au−6. NG orbits in the MPC and the Nakano Notes give values of 21.5 and 14 au−6, respectively, for 1/aori.
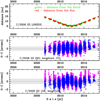 |
Fig. 6 Comet C/2006 S3 LONEOS. Upper panel: time distribution of positional observations. Lower panels: O–C diagram for GR (bottom panel) and NG (middle panel) orbits obtained using the full data arc; for the meaning of the lines and symbols, see Fig. 2. Prediscovery data were rejected because the residuals were too large. |
6.4 C/2008 S3 (Boattini)
C/2008 S3 was discovered on 2008 September 29 when it was 9.91 au from the Sun. Later, three series of predis-covery measurements were found: from 2007 December 18 (12.4 au from the Sun), 2007 December 4 (11.0 au), and 2006 December 27 (10.9 au). Each series consists of four mea- surements. Thus, the data arc covers 8.6yr in the heliocentric distance range of 12.4−8.01 au (perihelion)–11.7 au.
For this comet, only GR orbits could be determined. As a result, this comet was included in the LBg sample. The CODE catalog presents a GR orbit based on the complete data arc. This orbit fits the data with an RMS of 0742. The MPC and JPL also provide GR orbits based on the same data arc, fitted to posi- tional data with RMS values of 0.″60 and 0.″73, respectively (as of July 2023).
In addition, we checked that all prediscovery observations are also well-fitted to orbits based on the data arc starting from the discovery date. Here, we obtained GR orbits based on the PRE and POST data arcs with RMS values of 0.″48 and 0.″60, respectively.
GR orbits obtained using the complete and PRE data arcs result in almost the same original 1/a of 21.0 ± 0.3 and 21.3 ± 0.6 au−6, respectively. The GR orbital solution presented in the MPC gives a similar value of 21.0 ± 0.3 au−6 for 1/aori.
Series of GR solutions obtained for C/2006 S3 using three different sets of post-perihelion data arcs.
7 Original values of semimajor axes
Here, we give a detailed discussion of the values of the comets’ original semimajor axes. We focus on searching for correlations between these values obtained in GR and NG solutions based on the three types of data arcs analyzed here: (i) data before peri- helion (“PRE”), (ii) data after perihelion (“POST”), and (iii) all data (“FULL”).
7.1 Sample LAn
Values of 1/aori for GR orbits derived using the three types of data arcs are shown in Fig. 7 and are color-coded. The red, blue, and light green marks represent orbits based on FULL, PRE, and POST data arcs, respectively (also see Table 2 for details of the data arcs). By inspection of this figure, we note the following tendencies for GR orbits.
For all comets, 1/aori,full,GR < 1/aori,pre,GR. Thus aori,full,GR > aori,pre,GR, so the original semimajor axis inferred from the FULL data arc is larger than that derived from the PRE data arc. For the two comets with the largest perihelion distances, C/2005 EL173 and C/2013 G3, as well as for C/1999 H3, the PRE and FULL values are close to each other (they differ by less than 10 au−6). For the other comets in this sample, the 1/aori differences are as large as 30–40 au−6.
In ten of the eleven cases, we also have 1/aori,full,GR < 1/aori,post,GR. For comets C/2013 G3 and C/2000 CT54, the POST and FULL values are similar. Only C/1980 E1 has 1/aori,full,GR > 1/aori,post,GR.
Points 1 and 2 show that in ten of the eleven cases, the orig- inal semimajor axis based on the FULL data arc is larger than the semimajor axis obtained using either the PRE or POST data. These systematic trends in GR fits are so large that they cannot be explained by the uncertainties of orbits determined from different datasets. They must be related to the NG accelerations acting in the motion of these comets.
For four of the eleven cases (C/2017 M4, C/2016 N4, C/2012 F3, C/1999 H3), 1/aori,pre,GR ≃ 1/aori,post,GR. How- ever, both values differ substantially from 1/aori,full,GR.
For seven of the eleven comets, the original semimajor axis inferred from the PRE data arc is smaller than the values from both the POST and FULL data arcs: 1/aori,pre,GR > 1/aori,full,GR and 1/aori,pre,GR > 1/aori,post,GR.
If we include NG solutions for this analysis, then the relations between 1/aori values will depend on the assumed form of the g(r)-like function. Figure 8 shows the differences between 1/aori resulting from the NG orbit based on the standard form of the g(r) function (red and blue pentagons) and GR solutions (light red and light blue dots). First, the differences in original 1/a between GR and NG-std solutions based on the FULL data arc can reach 50 au−6. It is also noticeable that 1/aori,full,GR < 1/aori,full,NGstd. This systemic trend of 1/aori being larger for NG orbits is well-known (Squires & Beard 1961; Marsden et al. 1973, 1978; Królikowska 2001, Królikowska 2020; Yeomans et al. 2004; Rickman 2014). Marsden et al. (1978) found that for a sample of near-parabolic comets, most with perihelion distances q < 2 au, NG forces had a large effect on the inferred original semimajor axes. For a comet with q < 0.5 au, for exam- ple, a purely gravitational fit would typically yield a hyperbolic orbit (their Eq. (2)). Królikowska (2001) studied 33 comets whose original GR orbits were slightly hyperbolic, that is, 1/aori,GR < 0. For sixteen of the comets, she was able to fit NG orbits. In every case, 1/aori increased when NG effects were accounted for. Fourteen of the orbits changed from hyperbolic to elliptical, while the other two remained hyperbolic at the ≈2σ level.
The further analysis in this paper suggests that this correla- tion is related to the standard and HJ17 forms of the g(r)-like functions. For the NG-CO form of the g(r)-like function studied here, this systematic effect seems to be weaker.
However, we find other correlations. In all cases, the GR solution based on the FULL data arc gives values of 1/aori (light red dots in the figure) smaller than either the NG solution obtained using the FULL data arc (red pentagons) or the GR solution based on the PRE data arc (light blue dots). In other words, the GR orbit obtained with the FULL data arc results in the largest original semimajor axis of these three solutions.
In addition, in ten of eleven cases, the original semima- jor axes satisfy the relationship 1/aori,full,GR < 1/aori,PRE,GR < 1/aori,full,NGstd. The exception is C/2015 O1, for which 1/aori,full,GR < 1/aori,full,NGstd < 1/aori,PRE,GR. Moreover, for eight of the comets, the red pentagons and light blue dots coincide (C/1980 E1, C/2016 N4, C/2012 F3, C/2013 G3, C/2005 EL173) or are very close to each other (C/2017 M4, C/1997 BA6, C/2015 O1). For these comets, the GR orbit based on the PRE data arc gives a very similar original semimajor axis (differences in 1/aori are less than 5 au−6) as in the case of the NG solution based on the FULL data arc and standard g(r) form. Thus, an analysis of these three types of solutions shows that the value of 1/aori,GR based on the PRE solution is in all cases closer to the NG-std solution based on the FULL data arc than the value based on the GR orbit derived from the FULL data arc. In this way, we confirm the intuitive conclusion that the GR solution based on the PRE data arc is better suited for studying the origin of comets with perihelion distances q < 4 au, as well as when it is not possible to reliably determine NG orbits from the FULL data arc (when assuming the standard form of the g(r) function).
Assuming the g(r)-like function of HJ17 for sublimation of water ice from the subsolar point, the values of 1/aori for most comets analyzed here are quite similar to those for the NG-std case. Figure 8 shows values of 1/aori for the g(r)-like form describing sublimation from the subsolar point for four comets (gold points), while for three of them (C/2017 M4, C/1997 BA6, and C/2015 O1) this type of NG solution gives the smallest RMS between the three forms of NG solutions based on the complete datasets (Table 5). They, however, represent a typical situation for the relative location of 1/aori,full,NGstd and 1/aori,full,NGsubsolar. Among the remaining NG orbits based on HJ17, only in the case of comet C/1999 H3 is the value of 1/aori,full,NGsubsolar sig- nificantly smaller than 1/aori,full,NGstd and is equal to 89.53 ± 3.78 au−6 (not given in the figure because the RMS is worse than for the NG orbit based on the standard g(r) formula).
For the g(r)-like function describing CO ice sublimation, the situation is different from water-ice sublimation. Figure 8 also shows 1/aori for the NG-CO solution based on the FULL data arc (magenta triangles) and the PRE data arc (dark blue trian- gles) for comets from the sample LAn. For at least half of the cases, this form of the g(r)-like function gives a slightly worse orbital fit to the data arc (Sect. 4). The positions of the red, gold, and magenta marks show that the value of 1/aori depends on the assumed form of the g(r)-like function. In addition, there is not such a clear systematic effect for NG-CO orbits as there was for the NG orbits assuming water sublimation. The relationship  applies to four of the eleven comets − C/2016 N4, C/1999 H3, C/2015 O1, and C/2005 EL173 – when we used the NG-CO form with r0 = 10 au. However, for all four comets for which we tested r0 = 50 au (inverted triangles in the figure), the values of 1/aori are notably smaller than those using the NG-CO form with r0 = 10 au. The values of 1/aori obtained using r0 = 50 au are smaller than 1/aori,full,GR for the next two comets (C/2017 M4 and C/2000 SV74). Note that for these two comets, assuming r0 = 50 au gives slightly hyperbolic original orbits.
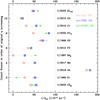 |
Fig. 7 Original 1/a values for the LAn sample using the whole data arc (light red dots, 1/aori,full,GR), pre-perihelion arcs (light blue, 1/aori,pre,GR), and post-perihelion arcs (light green, 1/aori,post,GR) based on purely gravitational orbital solutions. Comets with long data arcs, perihelion distances between 3.1 au and 3.9 au, and detectable NG effects using positional data are presented (Sample LAn). Comets are ordered on the vertical axis according to their original perihelion distances; see Table 2. |
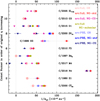 |
Fig. 8 Original 1/a values for the same comets as in Fig. 7 using FULL and PRE data arcs and both GR and a variety of NG solutions, where NG solutions obtained using the whole data arcs are shown by red pentagons (standard g(r), 1/aori,full,NG–std), and magenta triangles (g(r)-like function based on CO sublimation, 1/aori,full,NG–CO), while upward-pointing and inverted triangles show orbits using r0 = 10 au and r0 = 50 au, respectively. Inverted triangles are given for four comets only; we provide further discussion in Sects. 4 and 7.1. |
7.2 Sample LBn
For comets with q > 4.5 au, only the g(r)-like form that describes CO-driven sublimation is analyzed. Figure 9 includes 1/aori obtained for LPCs in the samples LBn and LBg. The red and magenta labels given on the right side of this plot indicate comets from the LBn sample. Those marked in red are comets with NG orbits obtained in the present study, while those in magenta are the remaining comets of the Sample LBn.
For seven comets in Sample LBn (all except C/2010 U3, which gave an unphysical solution with A1 < 0), we calculated 1/aori using a g(r)-like function for CO, but with r0 = 50 au. Those points are shown as inverted triangles. Using this value of r0 does not improve the RMS or [O–C] of the fits; in two cases, the RMS is worse (Table 5).
Seven of the eight comets in this sample fulfill the rela- tionship 1/aori,full,GR < 1/aori,pre,GR; the reverse applies only for C/1999 U4. In the case of C/2010 U3, the figure shows two GR solutions based on the PRE data arcs (light blue points). The light blue point with the “sh” label indicates the solution based on the data arc limited to distances greater than 14 au from the Sun. In this case, 1/aori is also smaller than the value resulting from a GR orbit based on a FULL data arc.
For six of eight LPCs, we have 1/aori,full,GR < 1/aori,post,GR, while the opposite is true for C/2006 S3 and C/2010 U3. How- ever, for these two comets, both values of 1/aori are very close to each other.
When considering all three data arcs, for five of eight LPCs, the GR orbit based on the FULL data arc gives a smaller value of 1/aori than the other two GR solutions (based on PRE and POST data arcs). For comets C/1999 U4, C/2006 S3, and C/2010 U3, this relationship does not hold.
In other words, although we observe some relationships between the values of 1/aori for different types of GR orbits, the trends are weaker than they are for the LAn sample. This may be a consequence of the generally weaker NG effects for comets in the LBn sample than in the LAn sample. In this sam- ple, all values of 1/aori for the three GR solutions (PRE, FULL, and POST data arcs) do not differ by more than 15 au−6 for six comets. The difference between 1/aori GR orbits is smaller than 25 au−6 for the two remaining comets – C/2015 H2, which shows the strongest evidence of NG acceleration in the motion of the sample LBn, and C/2006 S3. However, when an orbit based on a distant part of the PRE data arc was considered (light blue point labeled as “sh” in Fig. 9), instead of an orbit based on the complete PRE data arc, this range of 1/aori decreased to about 10 au−6 for C/2006 S3 (GR and NG solutions based on full data and PRE+DIST data).
For six of seven comets with NG-CO orbits obtained using full data arcs and r0 = 50 au (inverted magenta triangles in the figure), the values of 1/aori are significantly smaller than those using the NG-CO form with = 10 au (only for C/2006 S3 is the reverse), and in five cases the values of 1/aori obtained with r0 = 50 au are smaller than 1/aori,full,GR. Additionally, we even find a negative value of 1/aori for C/2006 S3 when the PRE dataset is used.
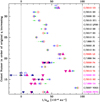 |
Fig. 9 Original 1/a for comets from samples LBn (marked by red and magenta labels on the right side of the figure) and LBg (black labels). Comets are ordered on the vertical axis according to their original perihelion distances. Three types of marks representing GR orbits are color-coded as in Fig. 8. NG solutions (triangles) are obtained using the g(r)-like function representing CO sublimation. Upward- and downward-pointing magenta triangles show orbits based on the whole data arc using r0 = 10 au and r0 = 50 au, respectively; small blue triangles indicate orbits using the PRE data arc; “sh” means solutions based on the distant part of the pre-perihelion data arc. On the right side of the figure, red names show comets with NG orbits determined here; magenta names indicate comets with NG orbits obtained earlier; black names show comets with indeterminable NG effects using positional data (sample LBg). |
7.3 Sample LBg
The NG effects in the motion of 13 of 32 LPCs analyzed here were indeterminable or very poorly determined using their positional datasets. There are some signs of NG effects for C/1999 N4 and C/2012 LP26, but they are highly uncertain.
The black labels in Fig. 9 indicate the LBg sample comets. For six of the thirteen LPCs (C/2010 R1, C/1999 F1, C/2010 S1, C/2012 K8, C/2012 LP26, C/2015 XY1, and C/2008 S3), the val- ues of 1/aori,full,GR (light red dots) and 1/aori,pre,GR (light blue dots) are very close to each other (values differ by no more than 2 au−6). In all of these cases, 1/aori,post,GR, shown with a light green point, also has a very similar value but typically is more different than the other two. The LBn sample contains three cases like this (C/2008 FK75, C/2005 L3, and C/2010 U3).
Unlike the previous two samples, as many as seven comets in sample LBg exhibit the opposite relationship 1/aori,pre,GR < 1/aori,ful,GR. The 1/aori,pre,GR > 1/aori,full,GR trend observed in the LAn and LBn samples thus does not apply here.
In addition, the LBg sample contains as many as nine comets with 1/aori,post,GR < 1/aori,full,GR, although the difference between both values is very small for three of these comets. We tentatively conclude that determining the orbit solely from the POST data arc will typically result in original orbits with a greater semima- jor axis than the comet has in reality. In general, however, in the LBg sample, all three values of 1/aori for GR solutions (PRE, FULL, and POST data arcs) do not differ by more than 15 au−6.
8 Final remarks and conclusions
This study shows that the motion of comets can often be measur- ably affected by NG forces at heliocentric distances well beyond 5 au. However, it is difficult to accurately model NG accelera- tions far from the Sun (Table 8 and Fig. 9). NG effects are also a source of additional uncertainties resulting from the adopted form of the g(r)-like function (Fig. 8). Therefore, the orbital changes caused by the NG acceleration far from the Sun con- stitute a serious obstacle in dynamical studies of the origin of comets on near-parabolic orbits, that is to say, comets with eccentricities very close to one (Fig. 9, also see Jewitt et al. 2021). In such cases, determining whether a comet is dynami- cally new or old requires an individual approach for each object (Sects. 4–6).
In general, when the PRE arc includes data at large heliocen- tric distances, the original 1/a uncertainty associated with the NG effects is minimized. Unfortunately, such observations are not available for all comets. In practice, it is necessary for each comet to balance the benefits of limiting the action of NG accel- eration (the farther from the Sun, the better) and the quality of the obtained orbit (the longer the data arc, the better). This paper shows how this works for comets found at about 7 au from the Sun. Fortunately, the number of LPCs discovered at even larger distances, such as comet C/2010 U3 (large q ≈ 8.4 au; Table 1) analyzed here, or C/2017 K2 (small q ≈ 1.8 au) discussed in Jewitt et al. (2021) and Dybczyńki & Królikowska (2022), will increase in the future.
Another interesting issue is the usefulness of data recorded well before the discovery of the comet to test the existence of traces of NG acceleration in the motion of the comet far from the Sun. The two prominent cases discussed in this study with such data are C/2010 U3 and C/2006 S3. Prediscovery data proved to be important in the orbit determination for C/2010 U3. However, for C/2006 S3, the earliest prediscovery series of data could not be integrated into the models of motion applied here. The failure to fit C/2006 S3 may be due to some systematic error in the measured positions. However, it cannot be ruled out that the NG models used here are inadequate for this comet because, for example, a fragment broke away from the comet’s nucleus long before perihelion or the comet underwent an out- burst. Such an explanation, as one of many possibilities, seems potentially much more interesting in the context of constructing the NG model of motion for this comet.
Other general conclusions based on the analysis carried out in this research for LPCs with large perihelion distances are as follows:
For 19 of 32 LPCs discovered far from the Sun, there are notable trends in fitting the GR orbit within the data arc, which most likely indicate the action of NG forces. We deter- mine NG orbits of six comets for the first time. We discuss the NG orbit fitting to the data in comparison to the purely GR solutions (Sect. 5). The conclusion is that more refined NG models of motion should be constructed individually for each comet using photometry or spectroscopic observations if possible. We complete the discussion of new NG solutions in comets with large perihelia with several other examples, already known, such as C/2006 S3 (Sect. 6). However, such comparisons have never been shown in the literature before;
To calculate the past evolution of near-parabolic comets, even those with large perihelion distances are better studied using their orbits determined based on pre-perihelion data (the PRE data arc). For LPCs discovered far from the Sun, the data arc can even be limited to part of the pre-perihelion leg of the orbit. However, the orbit should remain of the highest quality. This is the recommended direction for examining the origin of LPCs, already suggested in our pre- vious research (Królikowska et al. 2012; Królikowska 2020). Nowadays, more comets are being discovered far from the Sun, so there will soon be more cases of this kind;
For three types of GR orbits (based on PRE, FULL, and POST data arcs), 1/aori can differ by up to 50 au−6 for LPCs with 3 au < q < 4 au (sample LAn). NG orbits based on different forms of the g(r)-like function result in sim- ilar differences in 1/aori for comets in this range of q (Fig. 8). For LPCs with perihelia > 4.5 au, these differences between GR orbits are always less than 25 au−6 (sample LBn), and in most cases less than 15 au−6 (samples LBg and LBn, Fig. 9). Differences at this level are of fundamen- tal importance in the study of the dynamical status of these objects and their origin. In this regard, particular attention should be paid to comets discovered after perihelion passage. Especially for such LPCs, finding prediscovery observations is invaluable;
In cases in which the NG effects can be determined, the value of 1/aori based on NG orbits using the standard form of the g(r) function and the FULL data arc is usually more com- patible with the 1/aori from the GR orbits determined from the PRE data arc than with the 1/aori for the other types of GR orbits (POST and FULL data arcs, sample LAn). Thus, when it is impossible to determine the NG orbit and the PRE data arc results in a GR orbit of high quality, it is worth using the PRE orbit to study the past evolution of LPCs, instead of using the GR orbit fitted to the FULL data arc;
These studies indicate that the systematic effect of smaller original semimajor axes for the NG orbits than the GR orbits (Marsden et al. 1973, 1978; Królikowska 2001, 2020; Yeomans et al. 2004; Rickman 2014) seems to be related to the specific form of the Marsden et al. (1973) g(r) function describing water-ice sublimation, in particu- lar to the heliocentric position of the “knee” of this function (Fig. 1). When using the g(r)-like form with a greater value of r0 (for example dedicated to CO sublimation, that is to say, comets with large perihelion distances as analyzed here), this systematic effect may not be so conspicuous (Sect. 7). We intend to investigate this issue in the future;
The g(r) form of Marsden et al. (1973) is a fit to a very sim- ple thermal model for a spherical cometary nucleus which assumes a single average value for the solar elevation angle seen by the nucleus, and neglects heat transport into the comet (Sect. 1; see, for example, Huebner et al. 2006). Rosetta’s encounter with comet 67P has shown the limita- tions of the Marsden et al. (1973) model. More elaborate NG force models exist (Sitarski 1990; Sekanina 1993a,b; Maquet et al. 2012), but such models have more free parameters and cannot yet be applied to a sufficiently large sample of near-parabolic comets for an analysis of a general nature13. However, it seems to us that using subsets of the data arc, a variety of expressions for g(r), and, when available, mea- sured sublimation rates (Królikowska 2004), is a promising direction for future study of Oort Cloud comets with the longest observation arcs and NG effects clearly visible in the positional data;
Orbit fits provided by JPL for comets assumed to have CO-driven activity set the knee in g(r) at r0 = 5 au. Both experimental data (Fray & Schmitt 2009; Luna et al. 2014) and activity of comets beyond 20 au (for example, Yang et al. 2021) imply that the real value of r0 must be larger. Here we have assumed r0 = 10 au for CO-driven activity in most cases, but have also tried r0 = 15, 30, and 50 au for some comets. In terms of the RMS and [O–C], these fits are generally of a similar quality to those with r0 = 10 au, but the inferred values of aori are surprisingly sensitive to the assumed r0. We will investigate this issue in future work;
Our analysis of NG effects based on positional data suggests that these effects can be substantially different before and after perihelion. Unfortunately, we were only able to deter- mine reliable NG orbits based on PRE and POST data for six comets. We found that for two comets, their NG parameters were larger after perihelion (four times bigger for C/2006 S6 and 30% larger for C/1997 BA6), and for three others, larger before perihelion (almost two times bigger for C/2017 M4, two times for C/2015 O1, and three times for C/2000 SV74), where the asymmetry was measured by comparing the value of
 for the NG solution using CO sub- limation. For the sixth comet, C/2008 FK75, the level of NG parameters before and after perihelion is comparable (the asymmetry is less than 10%); for more details, read- ers can refer to Fig. 10. However, the relative difference in NG activity depends on the assumed form of the g(r)-like function (Sect. 4.1).
Finally, it is worth highlighting that pre-perihelion observa- tions covering a wide range of large heliocentric distances allow us to accurately determine the original orbits of comets without the major uncertainties related to the existence of NG acceler- ation in the data arc considered. In the future, we will have to deal with such favorable cases more often as we discover more and more comets beyond Saturn’s orbit and even further from the Sun.
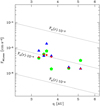 |
Fig. 10 Strength of NG acceleration acting on cometary nuclei at per- ihelion for six comets with determined NG parameters using PRE and POST data arcs, separately; both axes are on logarithmic scales. The value of FNG,max is calculated as: |

Acknowledgements
This research has made use of positional data of comets provided by the International Astronomical Union’s Minor Planet Center. We thank Mârio De Prâ, Piotr Dybczynski, Arika Higuchi, David Nesvorny, Zdenek Sekanina, Scott Tremaine, and Maria Womack for discussions and Marc Fouchard for a helpful review.
References
- A’Hearn, M. F., Feaga, L. M., Keller, H. U., et al. 2012, ApJ, 758, 29 [CrossRef] [Google Scholar]
- Attree, N., Jorda, L., Groussin, O., et al. 2019, A & A, 630, A18 [CrossRef] [EDP Sciences] [Google Scholar]
- Attree, N., Jorda, L., Groussin, O., et al. 2023, A & A, 670, A170 [NASA ADS] [CrossRef] [EDP Sciences] [Google Scholar]
- Bailer-Jones, C. A. L. 2022, ApJ, 935, L9 [NASA ADS] [CrossRef] [Google Scholar]
- Bockelée-Morvan, D., Crovisier, J., Mumma, M. J., & Weaver, H. A. 2004, in Comets II, eds. M. C. Festou, H. U. Keller, & H. A. Weaver (University of Arizona Press), 391 [Google Scholar]
- Bouziani, N., & Jewitt, D. 2022, ApJ, 924, 37 [NASA ADS] [CrossRef] [Google Scholar]
- Combi, M. R., Mäkinen, J. T. T., Bertaux, J.-L., Lee, Y., & Quémerais, E. 2009, AJ, 137, 4734 [NASA ADS] [CrossRef] [Google Scholar]
- Combi, M. R., Mäkinen, T. T., Bertaux, J. L., Quémerais, E., & Ferron, S. 2019, Icarus, 317, 610 [NASA ADS] [CrossRef] [Google Scholar]
- Combi, M. R., Shou, Y., Mäkinen, T., et al. 2021, Icarus, 365, 114509 [CrossRef] [Google Scholar]
- Combi, M. R., Mäkinen, T., Bertaux, J. L., Quémerais, E., & Ferron, S. 2023, Icarus, 398, 115543 [NASA ADS] [CrossRef] [Google Scholar]
- Cowan, J. J., & A’Hearn, M. F. 1979, Moon and Planets, 21, 155 [NASA ADS] [CrossRef] [Google Scholar]
- Davidsson, B. J. R., Samarasinha, N. H., Farnocchia, D., & Gutiérrez, P. J. 2022, MNRAS, 509, 3065 [Google Scholar]
- de Barros, A. L. F., Mejia, C., Seperuelo Duarte, E., et al. 2022, MNRAS, 511, 2491 [Google Scholar]
- Delsemme, A. H., & Miller, D. C. 1971, Planet. Space Sci., 19, 1259 [CrossRef] [Google Scholar]
- Dybczynski, P. A., & Breiter, S. 2022, A & A, 657, A65 [NASA ADS] [CrossRef] [EDP Sciences] [Google Scholar]
- Dybczynski, P. A., & Królikowska, M. 2022, A & A, 660, A100 [NASA ADS] [CrossRef] [EDP Sciences] [Google Scholar]
- Farnocchia, D., Bellerose, J., Bhaskaran, S., Micheli, M., & Weryk, R. 2021, Icarus, 358, 114276 [NASA ADS] [CrossRef] [Google Scholar]
- Fray, N., & Schmitt, B. 2009, Planet. Space Sci., 57, 2053 [Google Scholar]
- Fulle, M., Blum, J., & Rotundi, A. 2020, A & A, 636, A3 [Google Scholar]
- Gaia Collaboration (Brown, A. G. A., et al.) 2021, A & A, 649, A1 [NASA ADS] [CrossRef] [EDP Sciences] [Google Scholar]
- Gaia Collaboration (Vallenari, A., et al.) 2023, A & A, 674, A1 [NASA ADS] [CrossRef] [EDP Sciences] [Google Scholar]
- Gwyn, S. D. J., Hill, N., & Kavelaars, J. J. 2012, PASP, 124, 579 [NASA ADS] [CrossRef] [Google Scholar]
- Hansen, K. C., Altwegg, K., Berthelier, J. J., et al. 2016, MNRAS, 462, S491 [Google Scholar]
- Harrington Pinto, O., Womack, M., Fernandez, Y., & Bauer, J. 2022, PSJ, 3, 247 [Google Scholar]
- Huebner, W. F., Benkhoff, J., Capria, M.-T., et al., eds. 2006, Heat and Gas Diffusion in Comet Nuclei (Bern, Switzerland: International Space Science Institute) [Google Scholar]
- Hui, M.-T., & Jewitt, D. 2017, AJ, 153, 80 [NASA ADS] [CrossRef] [Google Scholar]
- Hui, M.-T., Farnocchia, D., & Micheli, M. 2019, AJ, 157, 162 [NASA ADS] [CrossRef] [Google Scholar]
- Ito, T. 2021, Earth Space Sci. Open Arch., https://essopenarchive.org/doi/full/10.1002/essoar.10507394.1 [Google Scholar]
- Ito, T., & Higuchi, A. 2020, Earth Space Sci. Open Arch., https://essopenarchive.org/doi/full/10.1002/essoar.10503960.4 [Google Scholar]
- Ivezić, Ž., Kahn, S. M., Tyson, J. A., et al. 2019, ApJ, 873, 111 [Google Scholar]
- Jewitt, D., Kim, Y., Mutchler, M., et al. 2021, AJ, 161, 188 [NASA ADS] [CrossRef] [Google Scholar]
- Jorda, L. & Gutiérrez, P. 2002, Earth Moon Planets, 89, 135 [Google Scholar]
- Jorda, L., Gaskell, R., Capanna, C., et al. 2016, Icarus, 277, 257 [Google Scholar]
- Kelley, M., Micheli, M., Farnocchia, D., et al. 2022, in AAS/Division for Planetary Sciences Meeting Abstracts, 54, 309.02 [NASA ADS] [Google Scholar]
- Knight, M. M., Kokotanekova, R., & Samarasinha, N. H. 2023, ArXiv e-prints [arXiv:2304.09309] [Google Scholar]
- Kramer, T., & Läuter, M. 2019, A & A, 630, A4 [CrossRef] [EDP Sciences] [Google Scholar]
- Królikowska, M. 2001, A & A, 376, 316 [CrossRef] [EDP Sciences] [Google Scholar]
- Królikowska, M. 2004, A & A, 427, 1117 [CrossRef] [EDP Sciences] [Google Scholar]
- Królikowska, M. 2020, A & A, 633, A80 [CrossRef] [EDP Sciences] [Google Scholar]
- Królikowska, M., & Dybczyński, P. A. 2017, MNRAS, 472, 4634 [Google Scholar]
- Królikowska, M., & Dybczyński, P. A. 2019, MNRAS, 484, 3463 [CrossRef] [Google Scholar]
- Królikowska, M., & Dybczyński, P. A. 2020, A & A, 640, A97 [CrossRef] [EDP Sciences] [Google Scholar]
- Królikowska, M., Sitarski, G., & Sołtan, A. M. 2009, MNRAS, 399, 1964 [Google Scholar]
- Królikowska, M., Dybczyński, P. A., & Sitarski, G. 2012, A & A, 544, A119 [CrossRef] [EDP Sciences] [Google Scholar]
- Kulyk, I., Rousselot, P., Korsun, P. P., et al. 2018, A & A, 611, A32 [CrossRef] [EDP Sciences] [Google Scholar]
- Luna, R., Satorre, M. A., Santonja, C., & Domingo, M. 2014, A & A, 566, A27 [NASA ADS] [CrossRef] [EDP Sciences] [Google Scholar]
- Maggiolo, R., Gronoff, G., Cessateur, G., et al. 2020, ApJ, 901, 136 [NASA ADS] [CrossRef] [Google Scholar]
- Maquet, L., Colas, F., Jorda, L., & Crovisier, J. 2012, A & A, 548, A81 [NASA ADS] [CrossRef] [EDP Sciences] [Google Scholar]
- Marschall, R., Skorov, Y., Zakharov, V., et al. 2020, Space Sci. Rev., 216, 130 [Google Scholar]
- Marsden, B. G. 1997, Earth Moon Planets, 79, 3 [NASA ADS] [CrossRef] [Google Scholar]
- Marsden, B. G., Sekanina, Z., & Yeomans, D. K. 1973, AJ, 78, 211 [NASA ADS] [CrossRef] [Google Scholar]
- Marsden, B. G., Sekanina, Z., & Everhart, E. 1978, AJ, 83, 64 [CrossRef] [Google Scholar]
- Meech, K. J., & Svoren, J. 2004, in Comets II, eds. M. C. Festou, H. U. Keller, & H. A. Weaver (University of Arizona Press), 317 [Google Scholar]
- Meech, K. J., Kleyna, J. T., Hainaut, O., et al. 2017, ApJ, 849, L8 [NASA ADS] [CrossRef] [Google Scholar]
- Rickman, H. 2014, Meteor. Planet. Sci., 49, 8 [Google Scholar]
- Rousselot, P., Korsun, P. P., Kulyk, I. V., et al. 2014, A & A, 571, A73 [NASA ADS] [CrossRef] [EDP Sciences] [Google Scholar]
- Sárneczky, K., Szabó, G. M., Csák, B., et al. 2016, AJ, 152, 220 [Google Scholar]
- Schleicher, D. G., & Woodney, L. M. 2003, Icarus, 162, 190 [NASA ADS] [CrossRef] [Google Scholar]
- Schwamb, M. E., Jones, R. L., Yoachim, P., et al. 2023, ApJSS, 266, 22 [NASA ADS] [CrossRef] [Google Scholar]
- Sekanina, Z. 1988, AJ, 95, 911 [CrossRef] [Google Scholar]
- Sekanina, Z. 1992, in Asteroids, Comets, Meteors 1991, eds. A. W. Harris, & E. Bowell (Lunar and Planetary Institute), 545 [Google Scholar]
- Sekanina, Z. 1993a, AJ, 105, 702 [CrossRef] [Google Scholar]
- Sekanina, Z. 1993b, AJ, 106, 401 [CrossRef] [Google Scholar]
- Sekanina, Z. 2021, ArXiv e-prints [arXiv:2109.11120] [Google Scholar]
- Sekanina, Z., & Kracht, R. 2017, ArXiv e-prints [arXiv:1703.00920] [Google Scholar]
- Shi, J. C., Ma, Y. H., & Zheng, J. Q. 2014, MNRAS, 441, 739 [Google Scholar]
- Silsbee, K., & Tremaine, S. 2016, AJ, 152, 103 [NASA ADS] [CrossRef] [Google Scholar]
- Sitarski, G. 1990, Acta Astron., 40, 405 [NASA ADS] [Google Scholar]
- Squires, R. E., & Beard, D. B. 1961, ApJ, 133, 657 [NASA ADS] [CrossRef] [Google Scholar]
- Strazzulla, G., & Johnson, R. E. 1991, Astrophys. Space Sci. Lib., 167, 243 [NASA ADS] [CrossRef] [Google Scholar]
- Szabó, G. M., Kiss, L. L., Pál, A., et al. 2012, ApJ, 761, 8 [CrossRef] [Google Scholar]
- Womack, M., Sarid, G., & Wierzchos, K. 2017, PASP, 129, 031001 [Google Scholar]
- Womack, M., Curtis, O., Rabson, D. A., et al. 2021, PSJ, 2, 17 [CrossRef] [Google Scholar]
- Wysoczańska, R., Dybczyński, P. A., & Królikowska, M. 2020, MNRAS, 491, 2119 [Google Scholar]
- Yabushita, S. 1996, MNRAS, 283, 347 [Google Scholar]
- Yang, B., Jewitt, D., Zhao, Y., et al. 2021, ApJ, 914, L17 [NASA ADS] [CrossRef] [Google Scholar]
- Ye, Q., Kelley, M. S. P., Bolin, B. T., et al. 2020, AJ, 159, 77 [Google Scholar]
- Yeomans, D. K., Chodas, P. W., Sitarski, G., Szutowicz, S., & Królikowska, M. 2004, in Comets II, eds. M. C. Festou, H. U. Keller, & H. A. Weaver (University of Arizona Press), 137 [Google Scholar]


JPL uses the standard g(r) function for C/2017 M4, whereas for C/2015 O1, they use the same values of m, n, and k for CO sublimation that we list in Table 4, but set r0 = 5 au, which implies α = 0.040837; see Part B of Table 4. Figure 1 shows that this g(r)-like formula for CO is almost the same as Yabushita’s formula.
All Tables
Oort Cloud comets discovered before 2022 more than 10 au from the Sun or with prediscovery detections beyond 10 au.
Analyzed sample of large-perihelion LPCs with long data arcs; three samples are listed in order of increasing q.
NG parameters A1; A2, and A3 (in units of 10−8 au·day−2) for the NG orbits described in Table 5 for five comets from the sample LBn (CO sublimation) for which the NG effects are not given in the CODE catalog; uncertainties in the NG parameters are listed on the lines below each set of values.
Series of GR solutions obtained for C/2010 U3 using three different sets of pre-perihelion data arcs, each starting from 2005 November 5.
Series of GR solutions obtained for C/2006 S3 using three different sets of post-perihelion data arcs.
All Figures
|
Fig. 1 Comparison of the g(r)-like formulas used in this study and given in the literature; logarithmic scales are used on both axes and r is in au. The gray rectangle shows the range of heliocentric distances covered by all positional measurements used in this study (32 sets of data), while the light gray rectangle shows the range for C/2015 O1, chosen as a typical example for Sample LAn (see Table 2). |
| In the text | |
|
Fig. 2 Comets C/2000 SV74 (LINEAR; left column) and C/2015 O1 Pan-STARRS (right column). Upper panels: time distribution of positional observations with corresponding heliocentric (red curve) and geocentric (green curve) distances at which they were taken. The horizontal dotted line shows the perihelion distance for a given comet, whereas the vertical dotted line shows the moment of perihelion passage. Middle panels: [O–C]-diagrams for the NG orbit based on the CO-driven g(r)-like function and obtained using the full data arc, where residuals in right ascension are shown using magenta dots and in declination by blue open circles; gray horizontal bands around zero indicate the RMS level. Bottom panels: [O–C]-diagrams using residuals available at the Nakano Notes Database and obtained using the Yabushita (1996) form of the CO-driven g(r)-like function. |
| In the text | |
|
Fig. 3 Cornet C/2015 H2 Pan-STARRS. The left column shows the [O–C] diagrams for GR and NG solutions based on the full data arc, while the right column displays [O–C] diagrams for two different GR solutions based on pre-perihelion and post-perihelion data arcs, respectively. |
| In the text | |
|
Fig. 4 Cornet C/2009 F4 McNaught. Upper panels: time distribution of positional observations. Lower panels: O–C diagrams for selected orbital solutions described in the text; for the meaning of the lines and symbols, see Fig. 2. |
| In the text | |
|
Fig. 5 Comets C/2010 U3 Boattini (left column) and C/2013 V4 Catalina (right column). Upper panel: time distribution of positional observations. Lower panels: O–C diagrams for selected orbital solutions described in the text; for the meaning of the lines and symbols, see Fig. 2. |
| In the text | |
|
Fig. 6 Comet C/2006 S3 LONEOS. Upper panel: time distribution of positional observations. Lower panels: O–C diagram for GR (bottom panel) and NG (middle panel) orbits obtained using the full data arc; for the meaning of the lines and symbols, see Fig. 2. Prediscovery data were rejected because the residuals were too large. |
| In the text | |
|
Fig. 7 Original 1/a values for the LAn sample using the whole data arc (light red dots, 1/aori,full,GR), pre-perihelion arcs (light blue, 1/aori,pre,GR), and post-perihelion arcs (light green, 1/aori,post,GR) based on purely gravitational orbital solutions. Comets with long data arcs, perihelion distances between 3.1 au and 3.9 au, and detectable NG effects using positional data are presented (Sample LAn). Comets are ordered on the vertical axis according to their original perihelion distances; see Table 2. |
| In the text | |
|
Fig. 8 Original 1/a values for the same comets as in Fig. 7 using FULL and PRE data arcs and both GR and a variety of NG solutions, where NG solutions obtained using the whole data arcs are shown by red pentagons (standard g(r), 1/aori,full,NG–std), and magenta triangles (g(r)-like function based on CO sublimation, 1/aori,full,NG–CO), while upward-pointing and inverted triangles show orbits using r0 = 10 au and r0 = 50 au, respectively. Inverted triangles are given for four comets only; we provide further discussion in Sects. 4 and 7.1. |
| In the text | |
|
Fig. 9 Original 1/a for comets from samples LBn (marked by red and magenta labels on the right side of the figure) and LBg (black labels). Comets are ordered on the vertical axis according to their original perihelion distances. Three types of marks representing GR orbits are color-coded as in Fig. 8. NG solutions (triangles) are obtained using the g(r)-like function representing CO sublimation. Upward- and downward-pointing magenta triangles show orbits based on the whole data arc using r0 = 10 au and r0 = 50 au, respectively; small blue triangles indicate orbits using the PRE data arc; “sh” means solutions based on the distant part of the pre-perihelion data arc. On the right side of the figure, red names show comets with NG orbits determined here; magenta names indicate comets with NG orbits obtained earlier; black names show comets with indeterminable NG effects using positional data (sample LBg). |
| In the text | |
|
Fig. 10 Strength of NG acceleration acting on cometary nuclei at per- ihelion for six comets with determined NG parameters using PRE and POST data arcs, separately; both axes are on logarithmic scales. The value of FNG,max is calculated as: |
| In the text | |
Current usage metrics show cumulative count of Article Views (full-text article views including HTML views, PDF and ePub downloads, according to the available data) and Abstracts Views on Vision4Press platform.
Data correspond to usage on the plateform after 2015. The current usage metrics is available 48-96 hours after online publication and is updated daily on week days.
Initial download of the metrics may take a while.