Open Access
Fig. 5
Download original image
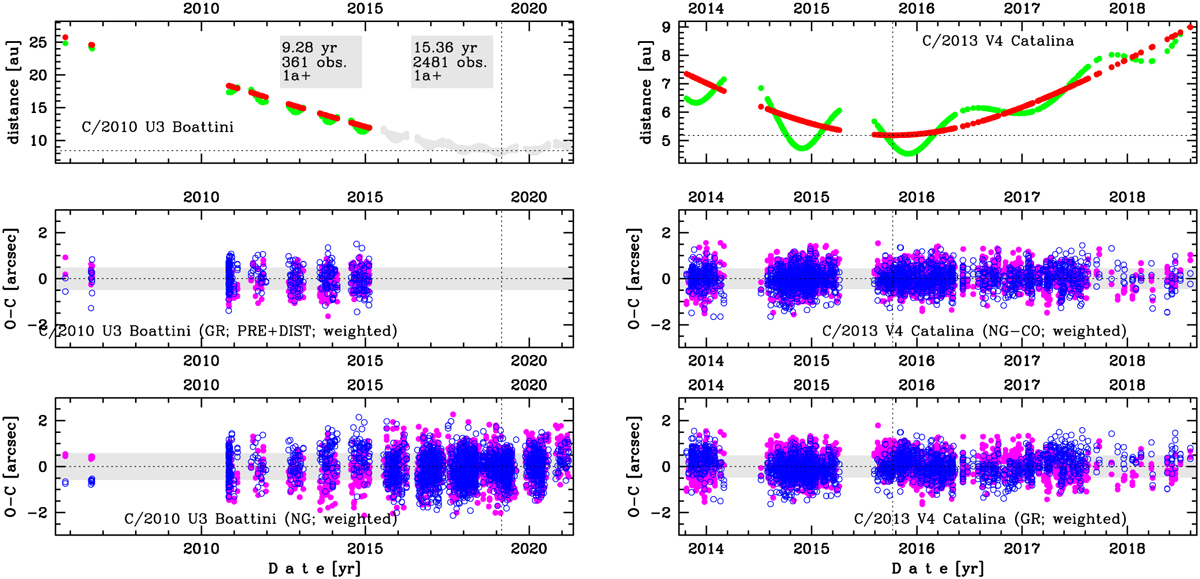
Comets C/2010 U3 Boattini (left column) and C/2013 V4 Catalina (right column). Upper panel: time distribution of positional observations. Lower panels: O–C diagrams for selected orbital solutions described in the text; for the meaning of the lines and symbols, see Fig. 2.
Current usage metrics show cumulative count of Article Views (full-text article views including HTML views, PDF and ePub downloads, according to the available data) and Abstracts Views on Vision4Press platform.
Data correspond to usage on the plateform after 2015. The current usage metrics is available 48-96 hours after online publication and is updated daily on week days.
Initial download of the metrics may take a while.