Fig. 2
Download original image
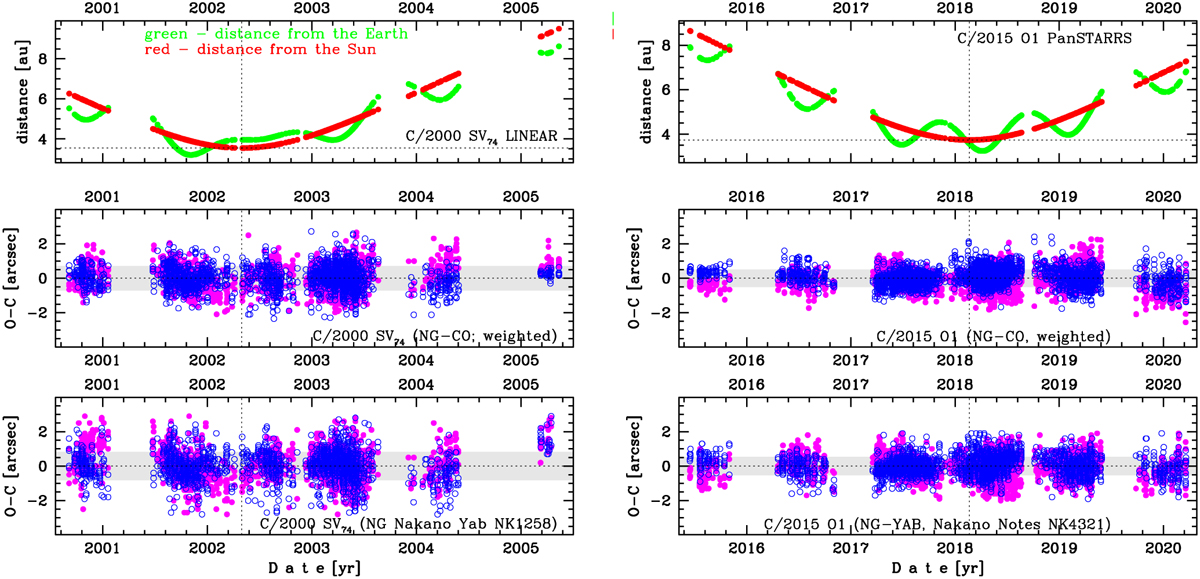
Comets C/2000 SV74 (LINEAR; left column) and C/2015 O1 Pan-STARRS (right column). Upper panels: time distribution of positional observations with corresponding heliocentric (red curve) and geocentric (green curve) distances at which they were taken. The horizontal dotted line shows the perihelion distance for a given comet, whereas the vertical dotted line shows the moment of perihelion passage. Middle panels: [O–C]-diagrams for the NG orbit based on the CO-driven g(r)-like function and obtained using the full data arc, where residuals in right ascension are shown using magenta dots and in declination by blue open circles; gray horizontal bands around zero indicate the RMS level. Bottom panels: [O–C]-diagrams using residuals available at the Nakano Notes Database and obtained using the Yabushita (1996) form of the CO-driven g(r)-like function.
Current usage metrics show cumulative count of Article Views (full-text article views including HTML views, PDF and ePub downloads, according to the available data) and Abstracts Views on Vision4Press platform.
Data correspond to usage on the plateform after 2015. The current usage metrics is available 48-96 hours after online publication and is updated daily on week days.
Initial download of the metrics may take a while.