Fig. 9
Download original image
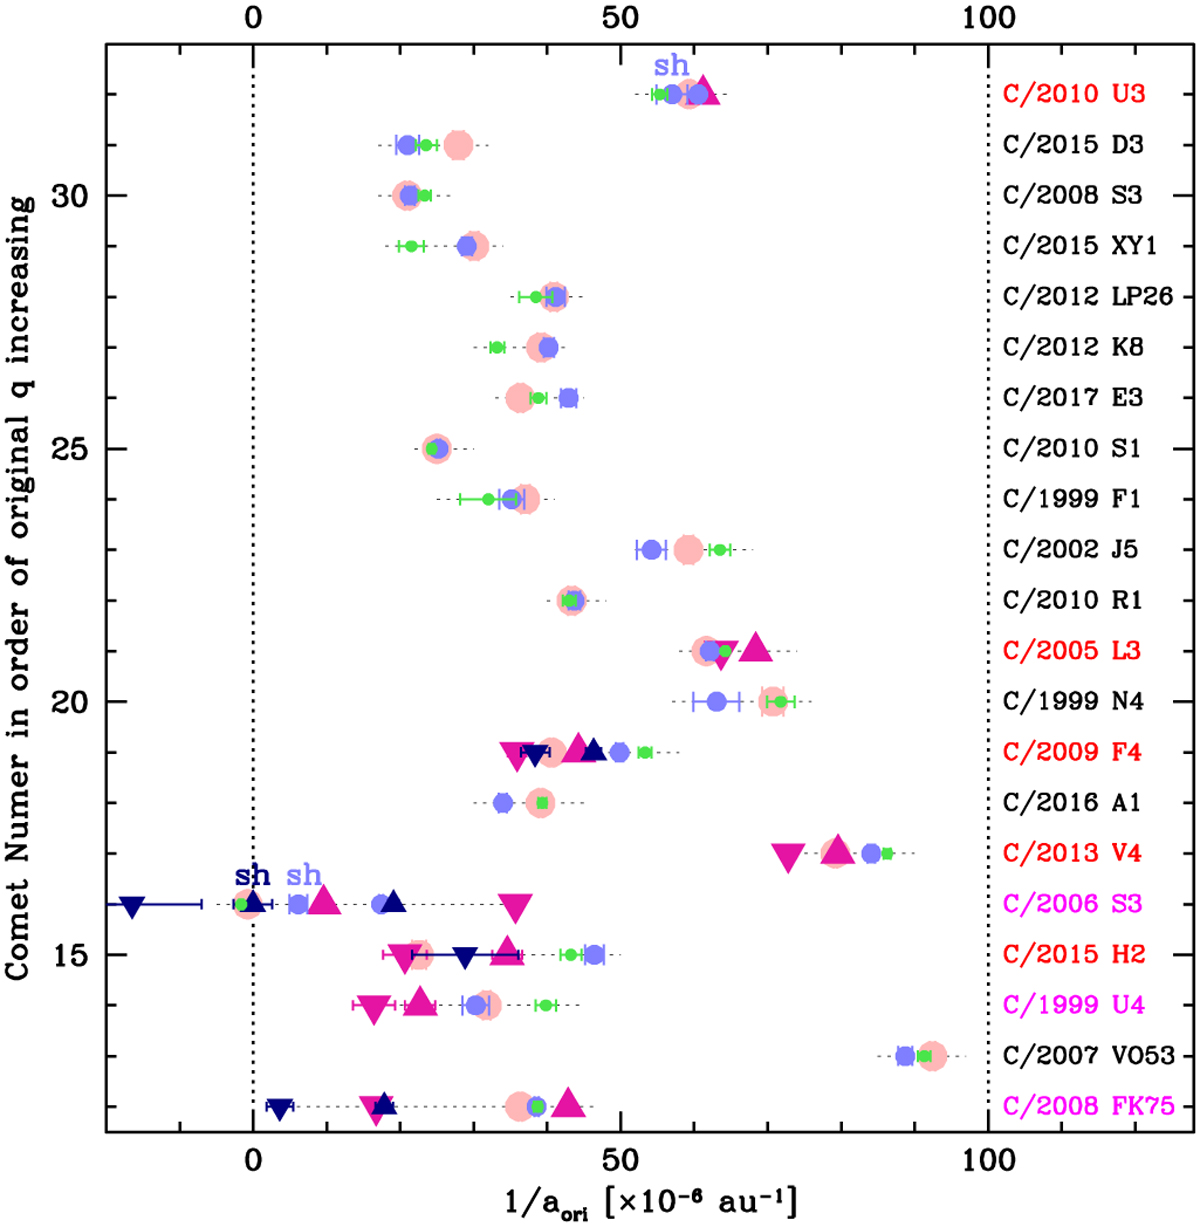
Original 1/a for comets from samples LBn (marked by red and magenta labels on the right side of the figure) and LBg (black labels). Comets are ordered on the vertical axis according to their original perihelion distances. Three types of marks representing GR orbits are color-coded as in Fig. 8. NG solutions (triangles) are obtained using the g(r)-like function representing CO sublimation. Upward- and downward-pointing magenta triangles show orbits based on the whole data arc using r0 = 10 au and r0 = 50 au, respectively; small blue triangles indicate orbits using the PRE data arc; “sh” means solutions based on the distant part of the pre-perihelion data arc. On the right side of the figure, red names show comets with NG orbits determined here; magenta names indicate comets with NG orbits obtained earlier; black names show comets with indeterminable NG effects using positional data (sample LBg).
Current usage metrics show cumulative count of Article Views (full-text article views including HTML views, PDF and ePub downloads, according to the available data) and Abstracts Views on Vision4Press platform.
Data correspond to usage on the plateform after 2015. The current usage metrics is available 48-96 hours after online publication and is updated daily on week days.
Initial download of the metrics may take a while.