Fig. 1
Download original image
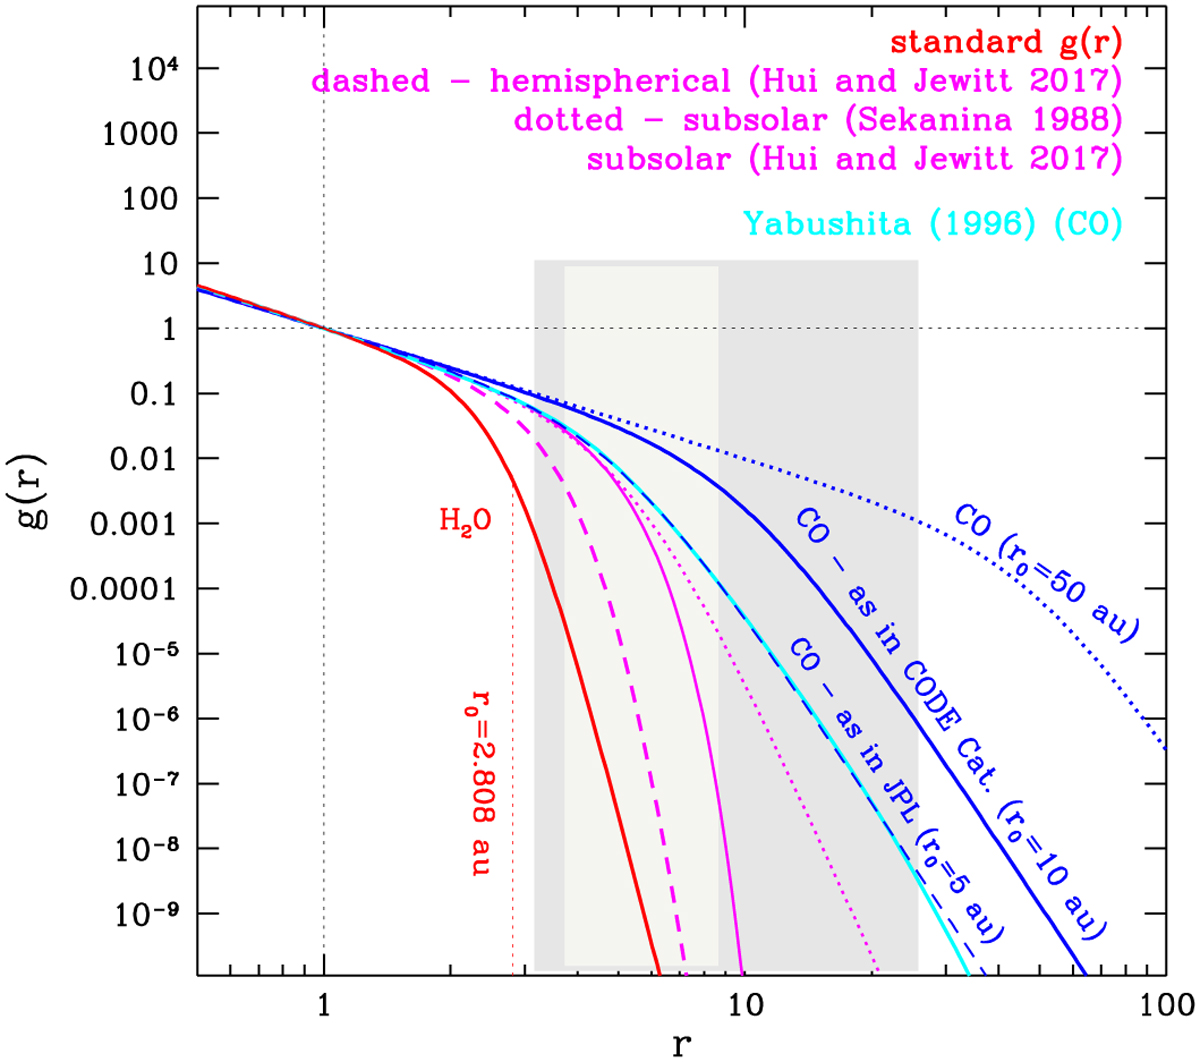
Comparison of the g(r)-like formulas used in this study and given in the literature; logarithmic scales are used on both axes and r is in au. The gray rectangle shows the range of heliocentric distances covered by all positional measurements used in this study (32 sets of data), while the light gray rectangle shows the range for C/2015 O1, chosen as a typical example for Sample LAn (see Table 2).
Current usage metrics show cumulative count of Article Views (full-text article views including HTML views, PDF and ePub downloads, according to the available data) and Abstracts Views on Vision4Press platform.
Data correspond to usage on the plateform after 2015. The current usage metrics is available 48-96 hours after online publication and is updated daily on week days.
Initial download of the metrics may take a while.