| Issue |
A&A
Volume 678, October 2023
|
|
|---|---|---|
| Article Number | A193 | |
| Number of page(s) | 11 | |
| Section | Astronomical instrumentation | |
| DOI | https://doi.org/10.1051/0004-6361/202346952 | |
| Published online | 24 October 2023 | |
Integrated turbulence parameters' estimation from NAOMI adaptive optics telemetry data★
1
Faculdade de Engenharia da Universidade do Porto,
Rua Dr. Roberto Frias s/n,
4200-465
Porto,
Portugal
e-mail: This email address is being protected from spambots. You need JavaScript enabled to view it.
2
CENTRA – Centro de Astrofísica e Gravitação, IST, Universidade de Lisboa,
1049-001
Lisboa,
Portugal
3
Space ODT – Optical Deblurring Technologies Unip Lda,
4050-277
Porto,
Portugal
4
European Southern Observatory,
Garching bei Muenchen,
Germany
Received:
19
May
2023
Accepted:
3
August
2023
Abstract
Context. Monitoring turbulence parameters is crucial in high-angular resolution astronomy for various purposes, such as optimising adaptive optics systems or fringe trackers. The former systems are present at most modern observatories and will remain significant in the future. This makes them a valuable complementary tool for the estimation of turbulence parameters.
Aims. The feasibility of estimating turbulence parameters from low-resolution sensors remains untested. We performed seeing estimates for both simulated and on-sky telemetry data sourced from the new adaptive optics module installed on the four Auxiliary Telescopes of the Very Large Telescope Interferometer.
Methods. The seeing estimates were obtained from a modified and optimised algorithm that employs a chi-squared modal fitting approach to the theoretical von Kármán model variances. The algorithm was built to retrieve turbulence parameters while simultaneously estimating and accounting for the remaining and measurement error. A Monte Carlo method was proposed for the estimation of the statistical uncertainty of the algorithm.
Results. The algorithm is shown to be able to achieve per-cent accuracy in the estimation of the seeing with a temporal horizon of 20 s on simulated data. A (0.76″ ± 1.2%|stat ± 1.2%|sys) median seeing was estimated from on-sky data collected from 2018 to 2020. The spatial distribution of the Auxiliary Telescopes across the Paranal Observatory was found to not play a role in the value of the seeing.
Key words: instrumentation: adaptive optics / instrumentation: high angular resolution / turbulence
Based on observations collected at the European Southern Observatory under ESO programme 60.A-9278(D).
© The Authors 2023
 Open Access article, published by EDP Sciences, under the terms of the Creative Commons Attribution License (https://creativecommons.org/licenses/by/4.0), which permits unrestricted use, distribution, and reproduction in any medium, provided the original work is properly cited.
This article is published in open access under the Subscribe to Open model. This email address is being protected from spambots. You need JavaScript enabled to view it. to support open access publication.
1 Introduction
Earth's atmosphere is widely understood as a turbulent fluid with local variations in temperature, density, and velocity that translate into fluctuations in the refractive index of the air. The changes in the refractive index impact the propagation of electromagnetic radiation (Roggemann et al. 1996; Wyngaard 2010). In strong turbulence, the electric field's amplitude and phase are affected, causing scintillation and blur. When the turbulence affects only the phase, we are in a low-turbulence environment; this is the case for this work.
The von Kármán model (Karman 1948) is widely used in adaptive optics (AO) as a descriptive model of the energy spectrum of turbulence and it describes the fluctuation of the refractive index (Avila 2021; Doelman 2020; Fétick et al. 2018). This model uses two turbulence parameters, the Fried parameter, r0, and the outer scale, ℒ0, to describe the average variance of the phase difference between two points separated by a distance, ρ, through a phase structure function, Dϕ. The model is used to ascertain the effects of the atmosphere on angular resolution through the seeing (Hardy 1998). The r0 indicates the separation over which a wavefront is aberrated by roughly a one-radian root mean square (Fried 1965). The outer scale dictates the inertial region of turbulence (Voitsekhovich 1995). It serves as a saturation parameter, which is absent in the Kolmogorov structure function (Kolmogorov 1941), and bounds the energy of the whole model.
The tracking of turbulence parameters is of importance to high-resolution astronomy:
in system commissioning and optimisation (Pepe et al. 2021);
in the reconstruction of the point-spread function (PSF; Wagner et al. 2022; Beltramo-Martin et al. 2019);
in the optimisation of fringe trackers (Lacour et al. 2019);
in site testing and characterisation (Zhu et al. 2023; Tillayev et al. 2021; Liu et al. 2015; Vázquez Ramió et al. 2012);
in the tracking of climate-induced changes (van Kooten & Izett 2022; Cantalloube et al. 2020);
in AO pre-compensation for free-space optical communications (Griffiths et al. 2023; Osborn et al. 2021).
Turbulence parameter tracking campaigns at Paranal, traditionally done with a MASS-DIMM system, have shown a need for complementary seeing estimates (Butterley et al. 2020; Osborn et al. 2018; Masciadri et al. 2014; Sarazin et al. 2008) due to non-consensual estimations between instruments. Complementary systems to MASS-DIMM are currently an open research question, and various system architectures have been put forward (Perera et al. 2023; Tokovinin 2021; Guesalaga et al. 2021).
The use of AO telemetry data for the estimation of integrated turbulence parameters is one such alternative (Jolissaint et al. 2018; Fusco et al. 2004). Adaptive-optics systems are ubiquitous in current and future-generation telescopes. Estimating turbulence parameters from telemetry data has the advantage of sourcing data from already-built systems. Additionally, since the processed AO telemetry is sourced directly from the observing telescopes, we have a line-of-sight seeing estimation for each telescope. Finally, since the telemetry encompasses the full light path from the guide star to the telescope, we can include the dome turbulence contribution to the seeing. The former is particularly interesting to high-resolution imaging since it has been shown to greatly impact image quality (Munro et al. 2023; Lai et al. 2019; Salmon et al. 2009).
Testing the algorithm on simulated and on-sky data is crucial to validate the estimation method. This study utilises the telemetry data produced by the new AO module of the Very Large Telescope Interferometer (VLTI), NAOMI (Woillez et al. 2019), to achieve this validation. NAOMI is installed on all four Auxiliary Telescopes (ATs) of the VLTI and can provide up to four concurrent telemetry samples. However, as a low-resolution system with a 4 × 4 Shack-Hartmann wavefront sensor (SH-WFS), it is a challenging scenario for estimating turbulence parameters from AO telemetry since only low-order modal variances are available for the fit. These additional complications affect the estimation of the turbulence parameters, and their impact is not yet understood.
We aim to conduct a quantitative validation and optimisation of the estimation algorithm under typical observing conditions at the Paranal Observatory by applying it to simulated data. Additionally, the analysis of real telemetry data (discussed in Sect. 4) aims to retrieve turbulence parameters observed at the Paranal Observatory from 2018 to 2020. This information will help to assess:
the performance of the algorithm in the estimation of the turbulence parameters from on-sky telemetry;
the distribution of the seeing across the Paranal Observatory;
the algorithm performance in comparison with currently employed seeing trackers.
In Sect. 2, the modal wavefront representation and reconstruction are detailed. The reconstruction challenges are described. The theoretical models for retrieving pseudo-open-loop modes and the fitting algorithm for estimating integrated turbulence parameters are presented. In Sect. 3, a simulated pipeline of the NAOMI system is used to validate and optimise the algorithm. Section 4 applies the optimised estimation algorithm to N = 8170 on-sky telemetry samples sourced from NAOMI. Conclusions are drawn in Sect. 5.
2 Methods
2.1 Reconstruction ofZernike coefficients
We chose to represent the wavefront, ϕ, as
 (1)
(1)
where M is the total number of modes, ai1 are the modal coefficients, Zi (ρ) is the Zernike polynomial of Noll order i, and ρ = (ρ/R, θ) represents the position vector in polar coordinates (Noll 1976). The piston contribution, i = 1, has been discarded in the representation since it plays no role in imaging through a single pupil.
The NAOMI system tracked wavefront aberrations using a Shack-Hartmann sensor. Conventionally (Southwell 1980), a set of slope measurements, s, is related to the modal coefficients of the Zernike wavefront expansion through
![Mathematical equation: $ {\bf{s}} = {\left[ {{s_1}, \ldots {s_{2N}}} \right]^T} = G{\bf{a}} + {\bf{e}}, $](/articles/aa/full_html/2023/10/aa46952-23/aa46952-23-eq2.png) (2)
(2)
where a N lenslet sensor is assumed. The gradient matrix, G, translates the Zernike coefficients into Shack-Hartmann slopes, and e is the measurement error, following the same convention and notation as Dai (1996).
For modelling purposes, we truncated the phase representation to a finite set of Zernike coefficients and split it into two subsets of the reconstructed, af, and remaining modes, ar. Equation (2) can be rewritten as
![Mathematical equation: $ {\bf{s}} = G\,\left[ {\matrix{ {{{\bf{a}}_{\bf{f}}}} \hfill \cr {{{\bf{a}}_{\bf{r}}}} \hfill \cr } } \right] + {\bf{e}} = H{{\bf{a}}_{\bf{f}}} + {G_{\rm{r}}}{{\bf{a}}_{\bf{r}}} + {\bf{e}}, $](/articles/aa/full_html/2023/10/aa46952-23/aa46952-23-eq3.png) (3)
(3)
where H are the first L columns of the G matrix, and Gr was constructed from the remaining higher-order columns. The least-squares solution of Eq. (3) is given as
 (4)
(4)
where b = [b2,…, bL]T are the reconstructed modal coefficients, and H+ is the reconstruction matrix obtained from the general inverse matrix of H,
 (5)
(5)
2.2 Pseudo-open slopes
The former discussion is valid for an AO system operating in open loop. Instead, the AO systems we are interested in operate in a negative feedback closed loop (Hardy 1998). To retrieve the complete phase coefficients, b, the control loop must be undone. Undoing the control loop corresponds to the summation of deformable mirror voltages, υDM, with the corresponding Shack-Hartmann slope measurements, sSH, in the modal space.
The modal coefficients for the deformable mirror, cDM, were obtained from the mirror voltages and the matrix that translated the response of the deformable mirror into mode coefficients, DM2M, through
 (6)
(6)
The residual modes, bSH, were obtained from the residual slopes, sSH, through the control matrix, CM, that translated Shack-Hartmann slopes into Zernike modes using
 (7)
(7)
A delay, τ, was introduced in the slope reconstruction to account for the system's response time. In the case of NAOMI, the total loop delay is 4.6ms (Woillez et al. 2019). The pseudo-open-loop coefficients were then
 (8)
(8)
2.3 Finite representation limitations
The relation between the true coefficients, a, and reconstructed coefficients, b, was obtained by substituting Eq. (3) into Eq. (4), such that
 (9)
(9)
where C is the cross-talk matrix defined by Dai (1996) as
 (10)
(10)
The C matrix introduced a dependence on the remaining modal coefficients in two ways: i) a geometric coupling due to the non-orthogonality of the Zernike polynomial derivatives (Herrmann 1981) and ii) the aliasing term. Although these are two different effects, they were treated as one – the remaining error, R.
2.4 Zernike coefficient variances
Estimating the Zernike modal variances requires the computation of the remaining error, which requires knowledge of the remaining modal variances. These were estimated through analytical expressions. The theoretical values for the von Kármán (co)-variance, (ararT)2, were obtained through the expressions derived by Takato & Yamaguchi (1995) and they are themselves a function of the Fried parameter, r0, and the outer scale, ℒ0.
The reconstruction also assumes that the measurement errors are equal and uncorrelated between measurements (Southwell 1980). As a consequence the variance of the measurement error, 〈e2〉, can be treated as a constant variance across slopes, such that
 (11)
(11)
The Zernike coefficient variances were evaluated from Eq. (9) through
 (12)
(12)
where 〈b2〉 represents the variance of the reconstructed modal coefficients and 〈ai,ajT〉 the (co-)variances of the exact modal coefficients. The measurement error is assumed to be uncorrelated from the modal coefficients (i.e. 〈earT〉 = 〈eafT〉 = 0). The variance of the reconstructed modes is then
 (13)
(13)
where  is associated with the measurement error in the Zernike space and is expressed as
![Mathematical equation: $ \sigma _{{\rm{n}},i}^2 = \sigma _0^2\,\left[ {{H^{\rm{T}}}H} \right]_{i,i}^{ - 1}, $](/articles/aa/full_html/2023/10/aa46952-23/aa46952-23-eq15.png) (14)
(14)
and the remaining error3, R, is given by
 (15)
(15)
where L is the number of fitted modes, M is the total number of modes, i represents the Zernike mode, and C are terms of the cross-talk matrix. Since Zernike polynomials are used in the real-time control of the NAOMI system, we opted to use them in favour of Karhunen-Loève modes. The Zernike basis is not statistically independent. This introduced the additional cross-term, 〈arafT〉, in the remaining error. There was then an additional explicit dependence on the remaining modes. As a result of this dependence, the R is larger when compared to statistically independent modes (the K-L modes; Dai 1996).
2.5 Turbulence parameter estimation algorithm
The integrated turbulence parameters, p = [r0, ℒ0], were estimated through the minimisation of the norm of the error function
 (16)
(16)
where
 (17)
(17)
This function is a vector in the Zernike modes that includes the analytical models for the von Kármán variances, 〈a2〉vk(p), the remaining error, R(p), and the measurement error,  .
.
A χ2 approach was employed (Bevington & Robinson 2003) to solve Eq. (16), thus expanding on previous work by Andrade et al. (2019). The χ2 approach requires knowledge of the squared uncertainty of each data point, in our case we assumed that the uncertainty of each radial order is constant. This constant value,  , was estimated by taking the variance of the reconstructed modes, 〈b2〉, in each radial order.
The uncertainty follows the approximate logarithmic scale of the von Kármán modal variances (cf. Appendix A). Each radial order has a singular theoretical modal variance shared between azimuthal orders, and, as such, any deviation from this variance is a deviation from the mean. This approach has the advantage of casting the minimisation problem as a known χ2 problem and achieving a homogeneous contribution of all radial orders to the fit without forcing a logarithmic scale, which was the case in previous implementations (Andrade et al. 2019).
The measurement and remaining error contributions to the ϵ2 function are much smaller in magnitude compared to  . Therefore, we chose to separate the estimation of the former from the global fit performed in Eq. (16):
–The measurement error was estimated through the use of the autocorrelation of the Zernike coefficients (Fusco et al. 2004; cf. Appendix B). This method estimates the measurement error as a vector across Zernike modes. Due to the reconstruction matrix, this is the case for the measurement error expressed in Eq. (14). Finally, this new approach was shown in simulation to perform better than a global fitting approach (Andrade et al. 2019) at a signal-to-noise ratio (S/N) < 1, while performing equally as well at a higher S/N (cf. Appendix C). We define the S/N as
 (18)
(18)
–The remaining error analytical expression (cf. Eq. (15)) is dependent on p. Although we could estimate both jointly, we chose to estimate each iteratively (Andrade et al. 2019). An iterative estimation of R(p) was found to be numerically much more convenient with the algorithm converging in a small number of iterations on all cases tested.
The iterative χ2 algorithm is then expressed as
 (19)
(19)
with
 (20)
(20)
where k represents the iteration of the algorithm and i represents the ith Zernike coefficient, thus summing over the terms of the variance vector. The tip and tilt modes were removed from the range of the fit (i.e. the minimisation starts at i = 4) as they are still largely affected by wind shake and telescope vibrations (Glück et al. 2017). While the defocus mode is also affected, we chose to use it in the reconstruction due to the small number of available modes. The maximum reconstructed modal variance included in the fit, L, is dictated by the number of modes controlled by the NAOMI system (L = 15; Woillez et al. 2019).
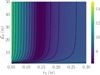 |
Fig. 1 χ2 minimisation map for Eq. (19) using simulated telemetry data. The colour bar represents the chi-squared value in a logarithmic scale. |
2.6 Algorithm convergence and sensitivity
The convexity is shown in the χ2 map of Fig. 1. The Fried parameter is shown to have a well-defined minimum, whereas the outer scale does not.
This confirms an expected result: the minimum measurable spatial frequency determines the maximum spatial scale detectable by the sensor. In the case of the ATs, the minimum measurable spatial frequency is fm = 1/D = 0.556 m−1, where D is the telescope diameter. As such, NAOMI is insensitive to spatial scales larger than its D = 1.8 m. The outer scale has been shown to vary between 1 and 100 m (Martin et al. 2000; Ziad et al. 2004), leading the ATs to be insensitive to most outer scale conditions.
2.7 Estimation of uncertainty
The following method estimates the statistical uncertainty of the fit, u(p)|stat. The statistical uncertainty is added to the systematic uncertainty of the algorithm to serve as a confidence interval for the estimated r0 when the algorithm is applied to on-sky telemetry, where the turbulence parameters are unknown.
We implemented a Monte Carlo simulation for the estimation of the uncertainty. This methodology uses random sampling to study the significance of the data. The random sample must mirror our data's statistical behaviour. For each radial order, n, the random sample,  , follows a normal distribution,
![Mathematical equation: $ {\left[ {\left\langle {{\bf{b}}_{{\bf{MC,i}}}^{\bf{2}}} \right\rangle } \right]_n} = {\left[ {N\left( {\overline {\left\langle {{\bf{b}}_{\bf{i}}^{\bf{2}}} \right\rangle } ,{\sigma _{\left\langle {{{\bf{b}}^{\bf{2}}}} \right\rangle ,i}}} \right)} \right]_n}, $](/articles/aa/full_html/2023/10/aa46952-23/aa46952-23-eq26.png) (21)
(21)
where the  is the mean modal variance of the radial order, n, for the reconstructed variances, 〈b2〉, and
  is the standard deviation around the mean. A new random sample,
  , was obtained by sweeping across the modes in Eq. (19) (i.e. i = 4 to i = 15). When applying the estimation algorithm to the new sample,
  , we obtained a new set of turbulence parameters from which we evaluated the uncertainty.
The Monte Carlo algorithm generates H = 50 random samples. The sample size was a good compromise between the computational load and the performance of the estimation. Since the study of the uncertainty is done by a repeated generation of new values of turbulence parameters, we are interested in calculating the error of the mean estimation. From the H turbulence parameters, the uncertainty of the mean is given by the standard deviation of the mean (Bevington & Robinson 2003). For the Fried parameter, the statistical uncertainty is given by
![Mathematical equation: $ u\left( {{r_0}} \right)\left| {_{{\rm{stat}}}} \right. = {1 \over H}\left[ {\sqrt {\sum\limits_{i = 1}^H {{{\left( {{r_{0,i}} - \overline {{r_0}} } \right)}^2}} } } \right], $](/articles/aa/full_html/2023/10/aa46952-23/aa46952-23-eq31.png) (22)
(22)
where  is the mean of the Fried parameter for the H samples and r0,i is the Fried parameter resulting from the estimation algorithm for each sample.
Section 4 uses the seeing, α, as a comparison tool to other independent estimation methods. It is obtained from the r0 through (Fried 1965)
 (23)
(23)
at a wavelength, λ, of 500 nm. The uncertainty of the seeing, u(α), is obtained directly from the uncertainty of the r0 through error propagation analysis. The u(α) is then given by
 (24)
(24)
where all variables, excluding the r0, are assumed to be true values with no uncertainty.
3 Algorithm validation and optimised performance
3.1 Simulation setup
The estimation algorithm was optimised entirely in python using the Object Oriented Python Adaptive Optics (OOPAO) package (Heritier 2023), which inherits the structure and functionality of its Matlab precursor OOMAO (Conan & Correia 2014). The generation of von Karman atmospheric phase screens was done using the algorithm proposed by Assémat et al. (2006) using the AOtools package (Townson et al. 2019).
The atmospheric parameters were kept constant throughout the simulation due to the assumed stationarity. Turbulence parameters vary in time, but we admit that they are stationary in the range of 1–2 min of acquisition (Ziad et al. 2004).
The simulation was performed in an open loop, implemented by propagating the generated phase screens through a telescope object and a diffractive model of the WFS with a lenslet field of view of 7.33″ to ensure linearity (Fig. 2). The slopes obtained from the SH-WFS were converted into Zernike modal coefficients using a synthetic control matrix. Finally, the variances of the reconstructed coefficients were introduced to the estimation algorithm to obtain the r0. The simulation was done in open-loop since the von Kármán model exists for uncorrected variances.
The telescope and WFS were configured per the prescription in Woillez et al. (2019) and are summarised in Table 1. The propagating phase screens are correlated and reflect the typical turbulence parameters of the Paranal Observatory (Table 2). Nine layers were used for the atmospheric model with the wind speed and altitude profiles following the values presented by Masciadri et al. (2013). Screens were generated at a 500 Hz loop frequency. SH-WFS measurements feature a Gaussian additive white noise with a known variance (σ = [10−6−10−7], cf. Eq. (11)). In the simulation, this corresponds to a 0.1−25 S/N regime. The average noise magnitude was taken from a N = 50 telemetry data sample representative of the entire set.
The telemetry samples already contain a gradient matrix, Gsystem, obtained from the inverted control matrix that accounts for the first 14 controlled modes. A much higher number of modes is needed for the estimation of the remaining error (cf. Eq. (15)). The estimation algorithm used a synthetic matrix, Gsynthetic, truncated between the second and 13th radial order (i.e. 90 modes) to calculate these terms. The synthetic matrix was obtained by registering the response of the Shack-Hartmann model to individual Zernike modes introduced at the telescope pupil. The matrix was validated against the Gsystem available in the telemetry samples and extended to additional modes once validation was achieved. The synthetic and system matrices were compared, and a median error of 1.3% was found between the two. This mismatch adds systematic error to our estimation algorithm.
The convergence bias of the algorithm was evaluated by comparing the turbulence parameters used to generate the phase screens, r0,screen, with the turbulence parameters obtained from the minimisation of the algorithm, r0,fit. For example, the percent relative difference,
 (25)
(25)
between the estimation of the algorithm and screen value gives us the accuracy of the estimated r0.
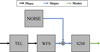 |
Fig. 2 Open-loop block diagram for the simulation. The phase screens were propagated through the telescope object, TEL, and were converted into a slope measurement by the wavefront sensor model, WFS. Measurement error, NOISE, was added to the slopes. The slopes were then converted into Zernike coefficients by matrix multiplication with the S2M matrix. |
Features of the NAOMI AO system.
Simulation conditions used in the generation of the phase screens.
Optimised parameters used in the iterative algorithm.
3.2 Algorithm parameter optimisation
Various fitting features of the iterative algorithm were tested and optimised; their optimised values are presented in Table 3. From the tested features:
The maximum radial order of the fit is the upper limit of fitting, L, of Eq. (19). The ideal number of modes was found to meet the condition of inclusion of all controlled modes by NAOMI (L = 15);
The maximum radial order of the remaining error corresponds to the maximum number of modes included in the calculation of the cross-talk matrix. The matrix was constructed from the corrected terms, H+, and the higher non-corrected terms, Gr. Letting the Gr matrix vary in size makes it possible to control the number of radial orders present in the estimation of the remaining error. Thus the estimation of turbulence parameters can be made to vary as a function of the maximum radial order included in the calculation of R. We note that
 was found to stabilise once the error estimation included the eighth radial order (Fig. 3). The optimal radial order does not coincide with the maximum available radial order. This is attributed to a mismatch between the models used for the simulation of the optical system and the one used for the estimation of f (p);
The minimum number of iterations, k, for which the estimation algorithm converges to a set of fitting parameters, pk, was shown to be small (k = 2). Once the threshold of k = 2 iterations is crossed, only sub-per-cent changes to the
 are registered;
The ideal starting parameters are obtained from the analysis of Fig. 1. An initial p with a small value of r0 is ideal for the minimisation, as the derivative of the χ2 is larger for small values of the Fried parameter.
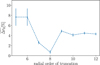 |
Fig. 3
|


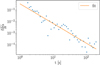 |
Fig. 4 Evolution of the convergence of the algorithm with time. The convergence of the algorithm was studied by monitoring the derivative of the turbulence parameter, |

3.3 Truncation of the time series
A large portion of our samples (88.50%) has a 20 s time horizon. We are interested in analysing the effects of truncation of the time series on the temporal convergence of the algorithm. The temporal evolution of the estimated Fried parameter,
 (26)
(26)
is represented in Fig. 4. The temporal evolution is studied by comparing the change in parameter estimation from time horizon t to t + Δt. The loop frequency of the system gives the time increment Δt. The temporal evolution is modelled as the power-law decay,
 (27)
(27)
The temporal evolution for a 20 s time horizon was retrieved from the fit of the model and was found to add an uncertainty of 0.2(2)%. The error of the uncertainty was calculated from the variance of the fitted parameters of the fit.
The convergence bias is assumed to be independent of the mismatch between synthetic and system matrices. The total systematic error is then the square sum of the two errors (u(r0)|sys = 1.2%).
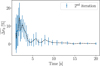 |
Fig. 5 Results for the simulated data (N = 17 samples). The second iteration estimation is represented. A maximum time horizon of 20 s is presented. Error bars represent a 3σ deviation to the sample's mean |

3.4 Optimised algorithm performance
Figure 5 indicates the algorithm's performance in estimating the Fried parameter as a function of the time horizon of the sample. The effects of the remaining error estimation were tested by comparing the k = 0 and k = 2 iteration of the algorithm. The algorithm's k = 0 iteration does not estimate the remaining error, while any iteration above the second was shown to be unnecessary. The optimised algorithm shows that the correction of the remaining error is necessary. Between the two iterations of the algorithm, an improvement in convergence bias from 17% to a sub-per cent is verified.
The algorithm's performance answers the feasibility question posed in Sect. 1. Sub-per-cent convergence bias estimations can be obtained in intervals of 20 s non-overlapping telemetry samples once the remaining error estimation is included in the fit for a 4 × 4 Shack-Hartmann sensor.
4 Results for NAOMI on-sky telemetry
4.1 Dataset analysis
The on-sky data were packaged following the telemetry data format proposed by Gomes et al. (2022). These data were curated following several criteria summarised in Table 4:
Data with a 500 Hz loop rate were selected. This loop ratio ensures a sufficient Strehl ratio in the samples. Lower loop frequencies are only active for high-R magnitude AO reference star samples with low H- and K-band Strehl ratios (Woillez et al. 2019);
A minimum time horizon of 20 s was selected. We note that 88.50% of the available data satisfy this condition;
N = 166 telemetry samples possess unviable data (cf. Fig. 6). We consider samples with a defocus 〈b2〉 below a 1 × 10⁻¹⁰ rad2 threshold to be incorrectly stored and remove them from the sample.
We ensure the correct confidence levels of the algorithm through an analysis of the uncertainty of the estimation. The per-cent statistical uncertainty of the algorithm estimation is shown in Fig. 7. The median statistical uncertainty is 1.2%. High uncertainty points were removed from the sample. We chose 10% as a threshold for acceptance. The N = 13 data points (less than 1%) were removed from the data sample this way. The total error of the estimation must include the systematic error. As such, the systematic error was added to the median uncertainty to obtain the median confidence level of (α + 1.2|stat% + 1.2|sys%).
Features of the NAOMI telemetry dataset.
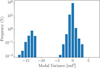 |
Fig. 6 Logarithmic histogram representation of the variance of the defocus mode for our data sample. Data points below an exponent of E–10 are considered to be empty datasets and have been removed from our sample. |
4.2 Agreement between ATs
Samples are gathered from the four ATs of the VLTI. These are spread across the observatory and monitor the same star. The four telescopes provide concurrent AO telemetry samples for the same observation. We can sample the spatial profile of the Paranal Observatory through the former with up to four concurrent seeing estimations. Table 5 summarises the difference in seeing estimates for concurrent telemetry samples by presenting the mean difference between telescopes. The error shown is the error of the mean for the data points. From Table 5, we conclude that:
the average difference between telescopes is 0.011″. This difference accounts for a 1.4% difference in average seeing across ATs. Since the median statistical uncertainty is 1.2%, and the systematic uncertainty is 1.2% for a 20 s time horizon, this points to an absence of a spatial profile of the seeing across Paranal within our uncertainty.
on average, the error around the mean is 0.005″, which results in a difference of 0.7% around the average seeing difference. The dispersion around the mean is small, demonstrating the robustness of the estimates.
Comparison of ATs' seeing estimations.
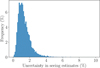 |
Fig. 7 Uncertainty of seeing estimates. The were obtained from applying the Monte Carlo method developed in Sect. 2 to the full NAOMI AO telemetry dataset before removing outliers. |
4.3 Comparison with DIMM
Differential image motion monitors (DIMM) are implemented at Paranal and give regular seeing estimates (Southern et al. 2015), which are used in this section for comparison to our estimates. The relationship between the two estimates is represented in Figs. 8 and 9. A linear trend between the two estimates is observed up to a limit of 1.5 arcsec, as illustrated in Fig. 9. This limit was chosen as a cutoff threshold for the analysis. Within the selected range, the DIMM and our seeing estimates agree with a Pearson correlation coefficient of 0.62. On average, a 5% larger seeing is estimated ( ).
).
Following Masciadri et al. (2023) DΓMM comparisons, we introduced bias and root-mean-square error (RMSE) defined as
 (28)
(28)
and
 (29)
(29)
where N is the number of telemetry samples, Xi is the observation of MAS S-DIMM, and Yi is the estimation of our algorithm.
We obtained BIAS = 0.03″ and RMSE = 0.22″. These results are consistent with those reported in Masciadri et al. (2023) for the comparison of values between Stereo-SCIDAR and MASS-DIMM, which are BIAS = 0.08″ and RMSE = 0.25″, respectively.
Consequently, these findings follow a larger trend of nonconsensual seeing estimates between the MASS-DΓMM system and other turbulence estimators (Butterley et al. 2020; Osborn et al. 2018). The ATs and the DIMM tower are located at different positions in the observatory, with the ATs occupying a central position while DIMM is installed at the edge of the observatory. The dome turbulence is an additional component in the telemetry data. The dome turbulence has been shown to play an important role in the total value of the seeing in larger telescopes than the ATs (Munro et al. 2023; Salmon et al. 2009). DIMM uses an open telescope design (Kornilov et al. 2007), which does not share a dome with the ATs. Coupling these factors and discarding systematic effects between the DIMM and NAOMI turbulence measurements, the local turbulence at the ATs seems to be larger than the one seen at the edge of the observatory.
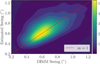 |
Fig. 8 Relationship between algorithm estimations and DIMM data. The Pearson correlation coefficient is 0.62 between the two datasets. The colour bar represents the density of points of a particular (αDIMM, αfit) set. |
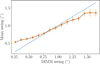 |
Fig. 9 Algorithm and DIMM seeing relationship trend. Points represent the mean seeing estimation of the algorithm when compared to the DIMM estimates for the same telemetry sample; the error bars present a 3σ confidence level of the mean individual estimation. |
5 Conclusions
This paper aimed to determine whether low-order (4 × 4) Shack-Hartmann wavefront sensor telemetry could be used to estimate integrated turbulence parameters. To come to a conclusion, an iterative estimation algorithm was first validated on simulated data and then applied to telemetry data produced from the operation of the AO system of the ATs of the VLT, NAOMI.
The estimation algorithm was optimised using a simulation of the NAOMI system. Simulation results show the ideal number of iterations, the minimum time horizon, and the number of modes to be included in the fitted variances and remaining error estimation. The χ2 map of the algorithm was shown to converge to the expected value without bias, and through its analysis, the ideal initial guess for our algorithm was established. The correction of the remaining and measurement error was shown to be necessary for the correct estimation of the Fried parameter. The uncorrected variances were shown to incorrectly estimate the Fried parameter, with an error of 17%. By compensating for the remaining error, we were able to achieve sub-per-cent convergence bias in the estimation of the parameter.
Following optimisation, the algorithm was applied to real on-sky data curated to remove undesirable samples totalling less than 1%. The uncertainty of the estimation of the seeing was first assessed. A median uncertainty of 1.2% was obtained.
A comparison of the seeing estimates between concurrent telemetry samples across the four available ATs showed consistency in our estimates. On average, all telescopes estimated the same seeing conditions for the same observation within the measurement uncertainty of 0.005″. The seeing was shown to be invariant across ATs. The average difference in seeing between telescopes is 0.011″. This difference is within the median algorithm uncertainty.
Our algorithm was compared to the DIMM seeing estimates. Disagreement between the two was found, with a correlation coefficient of 0.62 being determined. Our algorithm estimated 5% larger seeing conditions.
It was shown that the Fried parameter could be estimated from a low-order Shack-Hartmann system in a 1.8 m diameter telescope but not the outer scale. The next immediate step is to apply the algorithm to a higher-order system in a larger-diameter telescope. Larger telescope diameters imply a larger sensitivity to the outer scale. On the other hand, higher-order systems translate into less contamination of lower orders (more sensitive to the outer scale) via aliasing and crosstalk. The ideal test bench is the CIAO system installed in the Unit Telescopes.
Acknowledgements
The research leading to these results has received funding from the European Union's Horizon 2020 research and innovation programme under grant agreement 730890 (OPTICON) and 101004719 (OPTICON RadioNET Pilot), UIDB/00099/2020JJIPD/00099/2020 – funded by national funds through the FCT/MCTES (PIDDAC), and SFRH/BSAB/142940/2018. The data used in this work can be obtained in the ESO archive. The estimation methods discussed in Sect. 2 are made available to the community in the Turbulence Estimation Library (Turlib) Python package (Morujão 2023). We make available the documentation of the code at our Read the Docs page. We also provide case scripts for the estimation of turbulence parameters from simulated and on-sky telemetry data. These scripts employ the aotpy FITS reading data package (Gomes et al. 2022). We acknowledge and thank discussions of the telemetry data standard with Tiago Gomes.
Appendix A Logarithmic scale of the employed chi-squared weighting factors
In this appendix, we address the non-constancy of the weighting factors in the chi-squared fit. Through the top plot of Figure A.1, we exemplify the fitting of the algorithm to the theoretical variances. The theoretical and corrected variances overlap. We defined the corrected variances, 〈b2〉corr, as the subtraction of the estimated error from the reconstructed variances, such that
 (A.1)
(A.1)
The approximate logarithmic scale of the squared uncertainty of our data points is illustrated through the bottom plot of the figure, empirically validating the choice of  as a weight factor to the chi-squared model.
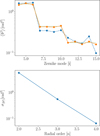 |
Fig. A.1 In the top graph: (i) the dashed line – the reconstructed variances, 〈b2〉, for a simulated telemetry sample; (ii) the dotted line – the theoretical von Karman variances of the phase screen turbulence parameters; and (iii) the solid line – the corrected variances. In the bottom graph: the weight factors, |

Appendix B Measurement error estimation from temporal autocorrelation of reconstructed coefficients
Since we assume that 〈e2〉 is temporally non-correlated, we can express the reconstructed modal variances through equation (13).
As such, the total reconstructed variance corresponds to the non-correlated measurement error contribution and remaining terms that depend on atmospheric variances. The temporal autocorrelation of the reconstructed Zernike coefficients, Ci(τ), for an individual Noll order, i, is then given as
 (B.1)
(B.1)
where Cturb,i(τ) is the temporal autocorrelation of the atmospheric contributions and  is the measurement error. The measurement error is retrieved from Ci(0) through the difference between Ci(0) and Cturb,i(0).
Since the measurement error is only present at τ = 0, we can estimate Cturb,i(0) through the polynomial fit of the first points of autocorrelation (excluding τ = 0). We note that Cturb,i(0) is estimated through the intercept at τ = 0.
The measurement error is introduced as white noise in the slopes, following a known standard deviation, σ (cf. equation (11)). Since the measurement error is obtained from the reconstructed coefficients, we need to take the effects of the reconstruction matrix, H, into account in the measurement error vector,  , through equation (14). As such, this error cannot be considered constant across Zernike modes. The S/N of individual Zernike modes is defined as
 (B.2)
(B.2)
and is represented in Figure B.l for modes of distinct radial orders, n. Due to the non-constant measurement error in the Zernike modes, we estimate the latter as a vector across all reconstructed modes.
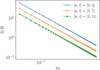 |
Fig. B.1 S/N for individual, i, Zernike modes in different radial orders, n. The measurement error was verified to be distinct between radial orders. |
Appendix C Fried parameter estimation performance comparison for different measurement error estimation techniques
To illustrate the choice of our estimation method, we tested both measurement error estimations:
Simultaneously with the fitting of equation (19), following the specifications outlined in Andrade et al. (2019);
Independently, using the methodology introduced by Fusco et al. (2004).
To illustrate their effect on the convergence of the algorithm, we applied both methods to simulated telemetry samples at different S/N regimes, following the same atmospheric conditions expressed in Section 3. The results are illustrated in Figure C.1. We find that the Fried parameter estimation by the autocorrelation method is more stable in the low S/N regime. As such, the estimation of the measurement error in the low S/N regime is improved, while performing equally as well in the high S/N regime. Additionally, by removing the measurement error from the chi-squared minimisation, we reduced the number of fitting variables from p = (r0, ℒ0, σ0) to p = (r0, ℒ0).
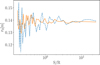 |
Fig. C.1 Estimation of the Fried parameter as a function of S/N, as defined by equation (18): (i) bold – autocorrelation of the reconstructed coefficients; and (ii) dashed – the global fit approach. |
References
- Andrade, P. P., Garcia, P. J. V., Correia, C. M., Kolb, J., & Carvalho, M. I. 2019, MNRAS, 483, 1192 [CrossRef] [Google Scholar]
- Assémat, F., Wilson, R. W., & Gendron, E. 2006, Opt. Express, 14, 988 [CrossRef] [Google Scholar]
- Avila, R. 2021, MNRAS, 507, L11 [NASA ADS] [CrossRef] [Google Scholar]
- Beltramo-Martin, O., Correia, C. M., Ragland, S., et al. 2019, MNRAS, 487, 5450 [NASA ADS] [CrossRef] [Google Scholar]
- Bevington, P. R., & Robinson, D. K. 2003, Data Reduction and Error Analysis for the Physical Sciences (McGraw-Hill: New York) [Google Scholar]
- Butterley, T., Wilson, R. W., Sarazin, M., et al. 2020, MNRAS, 492, 934 [NASA ADS] [CrossRef] [Google Scholar]
- Cantalloube, F., Milli, J., Böhm, C., et al. 2020, Nat. Astron., 4, 826 [NASA ADS] [CrossRef] [Google Scholar]
- Conan, R., & Correia, C. 2014, Proc. SPIE, 9148, 91486C [NASA ADS] [CrossRef] [Google Scholar]
- Dai, G.-M. 1996, J. Opt. Soc. Am. A, 13, 1218 [Google Scholar]
- Doelman, N. 2020, MNRAS, 491, 4719 [NASA ADS] [Google Scholar]
- Fétick, R. J. L., Neichel, B., Mugnier, L. M., Montmerle-Bonnefois, A., & Fusco, T. 2018, MNRAS, 481, 5210 [CrossRef] [Google Scholar]
- Fried, D. L. 1965, J. Opt. Soc. Am., 55, 1427 [NASA ADS] [CrossRef] [Google Scholar]
- Fusco, T., Rousset, G., Rabaud, D., et al. 2004, J. Opt. A Pure Appl. Opt., 6, 585 [CrossRef] [Google Scholar]
- Glück, M., Pott, J.-U., & Sawodny, O. 2017, PASP, 129, 065001 [CrossRef] [Google Scholar]
- Gomes, T., Correia, C., Bardou, L., et al. 2022, SPIE Conf. Ser., 12185, 121850H [NASA ADS] [Google Scholar]
- Griffiths, R., Osborn, J., Farley, O., et al. 2023, Opt. Express, 31, 6730 [NASA ADS] [CrossRef] [Google Scholar]
- Guesalaga, A., Ayancán, B., Sarazin, M., et al. 2021, MNRAS, 501, 3030 [NASA ADS] [Google Scholar]
- Hardy, J.W. 1998, Adaptive Optics for Astronomical Telescopes (Oxford: Oxford University Press on Demand), 16 [Google Scholar]
- Heritier, C. 2023, aO4ELT7 conference proceedings [Google Scholar]
- Herrmann, J. 1981, J. Opt. Soc. Am. (1917-1983), 71, 989 [CrossRef] [Google Scholar]
- Jolissaint, L., Ragland, S., Christou, J., & Wizinowich, P. 2018, Appl. Opt., 57, 7837 [CrossRef] [Google Scholar]
- Karman, T. V. 1948, Proc. Natl. Acad. Sci. USA, 34, 530 [CrossRef] [Google Scholar]
- Kolmogorov, A. N. 1941, Proc. R. Soc. London Ser. A, 434, 9 [NASA ADS] [Google Scholar]
- Kornilov, V., Tokovinin, A., Shatsky, N., et al. 2007, MNRAS, 382, 1268 [NASA ADS] [CrossRef] [Google Scholar]
- Lacour, S., Dembet, R., Abuter, R., et al. 2019, A&A, 624, A99 [NASA ADS] [CrossRef] [EDP Sciences] [Google Scholar]
- Lai, O., Withington, J. K., Laugier, R., & Chun, M. 2019, MNRAS, 484, 5568 [Google Scholar]
- Liu, L. Y., Giordano, C., Yao, Y. Q., et al. 2015, MNRAS, 451, 3299 [NASA ADS] [CrossRef] [Google Scholar]
- Martin, F., Conan, R., Tokovinin, A., et al. 2000, A&AS, 144, 39 [NASA ADS] [CrossRef] [EDP Sciences] [Google Scholar]
- Masciadri, E., Lascaux, F., & Fini, L. 2013, MNRAS, 436, 1968 [NASA ADS] [CrossRef] [Google Scholar]
- Masciadri, E., Lombardi, G., & Lascaux, F. 2014, MNRAS, 438, 983 [NASA ADS] [CrossRef] [Google Scholar]
- Masciadri, E., Turchi, A., & Fini, L. 2023, MNRAS, 523, 3487 [NASA ADS] [CrossRef] [Google Scholar]
- Morujão, N. 2023, Turlib: Turbulence estimation library [Google Scholar]
- Munro, J., Hansen, J., Travouillon, T., Grosse, D., & Tokovinin, A. 2023, J. Astron. Teles. Instrum. Syst., 9, 017004 [NASA ADS] [CrossRef] [Google Scholar]
- Noll, R. J. 1976, J. Opt. Soc. Am. (1917-1983), 66, 207 [Google Scholar]
- Osborn, J., Wilson, R. W., Sarazin, M., et al. 2018, MNRAS, 478, 825 [CrossRef] [Google Scholar]
- Osborn, J., Townson, M. J., Farley, O. J. D., Reeves, A., & Calvo, R. M. 2021, Opt. Express, 29, 6113 [NASA ADS] [CrossRef] [Google Scholar]
- Pepe, F., Cristiani, S., Rebolo, R., et al. 2021, A&A, 645, A96 [NASA ADS] [CrossRef] [EDP Sciences] [Google Scholar]
- Perera, S., Wilson, R. W., Butterley, T., et al. 2023, MNRAS, 520, 5475 [NASA ADS] [CrossRef] [Google Scholar]
- Roggemann, M. C., Welsh, B. M., & Hunt, B. R. 1996, Imaging Through Turbulence (Boca Raton: CRC press) [Google Scholar]
- Salmon, D., Cuillandre, J.-C., Barrick, G., et al. 2009, PASP, 121, 905 [NASA ADS] [CrossRef] [Google Scholar]
- Sarazin, M., Melnick, J., Navarrete, J., & Lombardi, G. 2008, ESO Messenger, 132, 11 [NASA ADS] [Google Scholar]
- Southern, E., Headquarters, O., Karl-Schwarzschild-Straße, G., et al. 2015, European Organisation for Astronomical Research in the Southern Hemisphere Programme: PIP Astronomical Site Monitor Data User Manual Change Record from previous Version Astronomical Site Monitor Data User Manual [Google Scholar]
- Southwell, W. 1980, J. Opt. Soc. Am., 70, 998 [NASA ADS] [CrossRef] [Google Scholar]
- Takato, N., & Yamaguchi, I. 1995, J. Opt. Soc. Am., 12, 958 [NASA ADS] [CrossRef] [Google Scholar]
- Tillayev, Y., Azimov, A., & Hafizov, A. 2021, Galaxies, 9, 38 [NASA ADS] [CrossRef] [Google Scholar]
- Tokovinin, A. 2021, MNRAS, 502, 794 [NASA ADS] [CrossRef] [Google Scholar]
- Townson, M., Farley, O., de Xivry, G. O., Osborn, J., & Reeves, A. 2019, Opt. Express, 27, 31316 [CrossRef] [Google Scholar]
- van Kooten, M. A. M., & Izett, J. G. 2022, PASP, 134, 095001 [NASA ADS] [CrossRef] [Google Scholar]
- Vázquez Ramió, H., Vernin, J., Muñoz-Tuñón, C., et al. 2012, PASP, 124, 868 [CrossRef] [Google Scholar]
- Voitsekhovich, V. V. 1995, J. Opt. Soc. Am. A, 12, 1346 [NASA ADS] [CrossRef] [Google Scholar]
- Wagner, R., Saxenhuber, D., Ramlau, R., & Hubmer, S. 2022, Astron. Comput., 40, 100590 [CrossRef] [Google Scholar]
- Woillez, J., Abad, J. A., Abuter, R., et al. 2019, A&A, 629, A41 [NASA ADS] [CrossRef] [EDP Sciences] [Google Scholar]
- Wyngaard, J. C. 2010, Turbulence in the Atmosphere (Cambridge: Cambridge University Press) [CrossRef] [Google Scholar]
- Zhu, L., Zhang, H., Sun, G., et al. 2023, MNRAS, 522, 1419 [NASA ADS] [CrossRef] [Google Scholar]
- Ziad, A., Schöck, M., Chanan, G. A., et al. 2004, Appl. Opt., 43, 2316 [CrossRef] [Google Scholar]
If not explicitly stated in this article, a modal coefficient is implicitly represented at a fixed time, t.
〈.〉 indicates the ensemble average of a parameter.
We notate the remaining error as R instead of σ2 as in Andrade et al. (2019) since the term can be negative.
All Tables
All Figures
|
Fig. 1 χ2 minimisation map for Eq. (19) using simulated telemetry data. The colour bar represents the chi-squared value in a logarithmic scale. |
| In the text | |
|
Fig. 2 Open-loop block diagram for the simulation. The phase screens were propagated through the telescope object, TEL, and were converted into a slope measurement by the wavefront sensor model, WFS. Measurement error, NOISE, was added to the slopes. The slopes were then converted into Zernike coefficients by matrix multiplication with the S2M matrix. |
| In the text | |
|
Fig. 3
|
| In the text | |
|
Fig. 4 Evolution of the convergence of the algorithm with time. The convergence of the algorithm was studied by monitoring the derivative of the turbulence parameter, |
| In the text | |
|
Fig. 5 Results for the simulated data (N = 17 samples). The second iteration estimation is represented. A maximum time horizon of 20 s is presented. Error bars represent a 3σ deviation to the sample's mean |
| In the text | |
|
Fig. 6 Logarithmic histogram representation of the variance of the defocus mode for our data sample. Data points below an exponent of E–10 are considered to be empty datasets and have been removed from our sample. |
| In the text | |
|
Fig. 7 Uncertainty of seeing estimates. The were obtained from applying the Monte Carlo method developed in Sect. 2 to the full NAOMI AO telemetry dataset before removing outliers. |
| In the text | |
|
Fig. 8 Relationship between algorithm estimations and DIMM data. The Pearson correlation coefficient is 0.62 between the two datasets. The colour bar represents the density of points of a particular (αDIMM, αfit) set. |
| In the text | |
|
Fig. 9 Algorithm and DIMM seeing relationship trend. Points represent the mean seeing estimation of the algorithm when compared to the DIMM estimates for the same telemetry sample; the error bars present a 3σ confidence level of the mean individual estimation. |
| In the text | |
|
Fig. A.1 In the top graph: (i) the dashed line – the reconstructed variances, 〈b2〉, for a simulated telemetry sample; (ii) the dotted line – the theoretical von Karman variances of the phase screen turbulence parameters; and (iii) the solid line – the corrected variances. In the bottom graph: the weight factors, |
| In the text | |
|
Fig. B.1 S/N for individual, i, Zernike modes in different radial orders, n. The measurement error was verified to be distinct between radial orders. |
| In the text | |
|
Fig. C.1 Estimation of the Fried parameter as a function of S/N, as defined by equation (18): (i) bold – autocorrelation of the reconstructed coefficients; and (ii) dashed – the global fit approach. |
| In the text | |
Current usage metrics show cumulative count of Article Views (full-text article views including HTML views, PDF and ePub downloads, according to the available data) and Abstracts Views on Vision4Press platform.
Data correspond to usage on the plateform after 2015. The current usage metrics is available 48-96 hours after online publication and is updated daily on week days.
Initial download of the metrics may take a while.