Fig. 2
Download original image
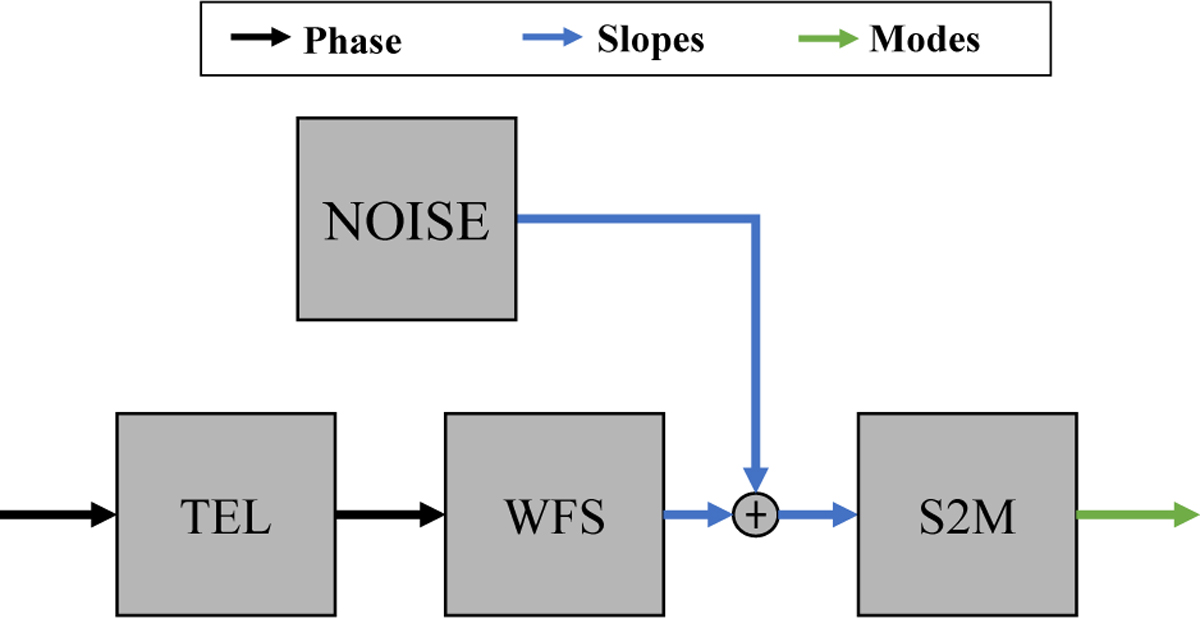
Open-loop block diagram for the simulation. The phase screens were propagated through the telescope object, TEL, and were converted into a slope measurement by the wavefront sensor model, WFS. Measurement error, NOISE, was added to the slopes. The slopes were then converted into Zernike coefficients by matrix multiplication with the S2M matrix.
Current usage metrics show cumulative count of Article Views (full-text article views including HTML views, PDF and ePub downloads, according to the available data) and Abstracts Views on Vision4Press platform.
Data correspond to usage on the plateform after 2015. The current usage metrics is available 48-96 hours after online publication and is updated daily on week days.
Initial download of the metrics may take a while.