Fig. A.1
Download original image
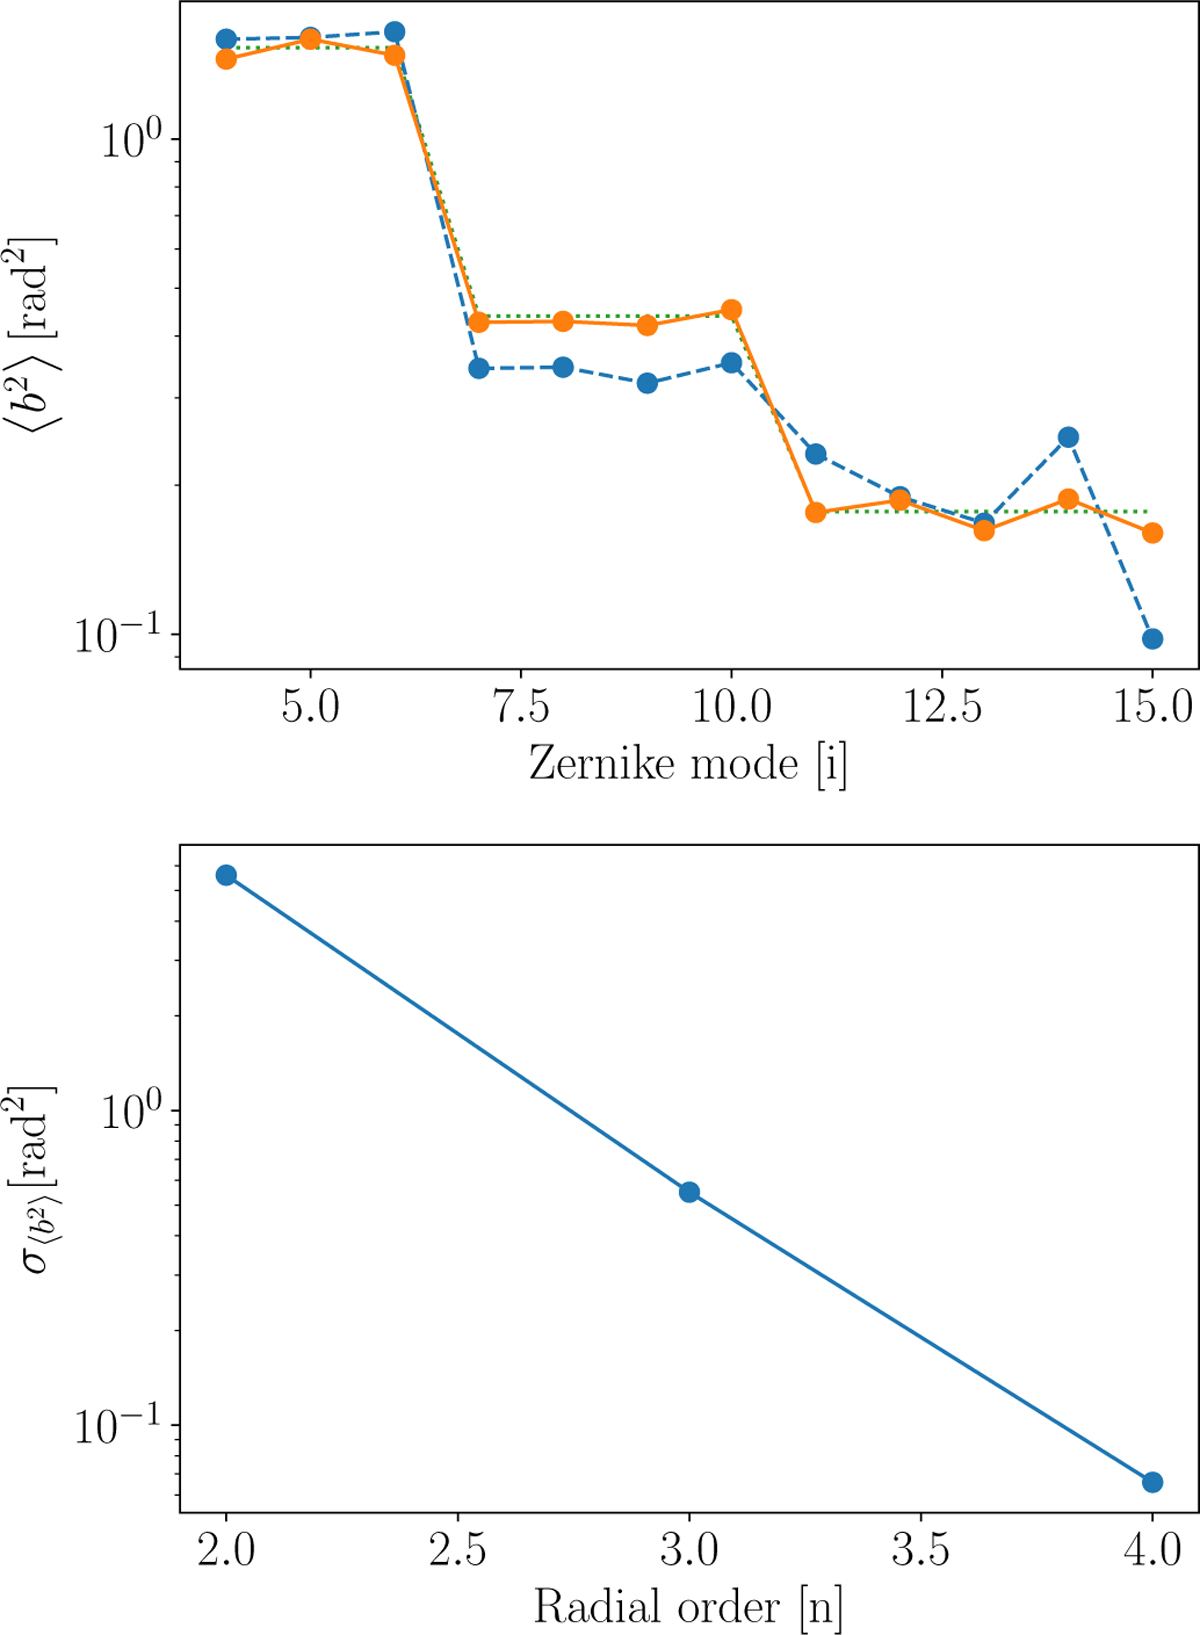
In the top graph: (i) the dashed line – the reconstructed variances, 〈b2〉, for a simulated telemetry sample; (ii) the dotted line – the theoretical von Karman variances of the phase screen turbulence parameters; and (iii) the solid line – the corrected variances. In the bottom graph: the weight factors, ![]() , obtained from the variance of each radial order of the reconstructed variances presented in the preceding graph.
, obtained from the variance of each radial order of the reconstructed variances presented in the preceding graph.
Current usage metrics show cumulative count of Article Views (full-text article views including HTML views, PDF and ePub downloads, according to the available data) and Abstracts Views on Vision4Press platform.
Data correspond to usage on the plateform after 2015. The current usage metrics is available 48-96 hours after online publication and is updated daily on week days.
Initial download of the metrics may take a while.