| Issue |
A&A
Volume 678, October 2023
|
|
|---|---|---|
| Article Number | A92 | |
| Number of page(s) | 7 | |
| Section | Astrophysical processes | |
| DOI | https://doi.org/10.1051/0004-6361/202346827 | |
| Published online | 10 October 2023 | |
Examining the relationship between the bulge-to-total stellar mass ratio and dwarf galaxy count in the context of ΛCDM
1
Institute of Physics, Laboratory of Astrophysics, École Polytechnique Fédérale de Lausanne (EPFL), 1290 Sauverny, Switzerland
e-mail: This email address is being protected from spambots. You need JavaScript enabled to view it.
2
Research School of Astronomy and Astrophysics, Australian National University, Canberra, ACT 2611, Australia
Received:
5
May
2023
Accepted:
17
July
2023
Abstract
Previous results suggest that there is a correlation between the size of the bulge of a galaxy and the number of its dwarf galaxy satellites. This was found to be inconsistent with the standard model of cosmology based on comparisons to semi-analytical dark-matter-only simulations, where no such correlation was found. In this work, we extend these studies using the volume-complete ELVES dwarf galaxy catalog, which increases the number of systems compared to previous work by a factor of four. For each giant galaxy we compiled the bulge-to-total baryonic mass (B/T) ratio and present it as a function of the number of dwarf galaxies surrounding them within 250 kpc (N250). For the 29 galaxy systems in the ELVES catalog, we find a linear relation between B/T and N250, which is consistent with previous data. However, for a given stellar mass of the host galaxy, this relation is mainly driven by the galaxies’ morphologies: early-type galaxies have a larger B/T ratio and a larger N250 than late-type galaxies. By investigating spiral galaxies in TNG100 of the IllustrisTNG suite, we tested whether the inclusion of baryons in the simulations would result in differences from those based on Millennium-II. Contrary to dark-matter-only simulations, we do find a correlation between B/T and N250, indicating that the standard model of cosmology does predict a correlation. The empirical relation between the number of satellites and the bulge to total stellar mass is therefore not necessarily in tension with Λ cold dark matter.
Key words: galaxies: dwarf / Galaxy: abundances / Galaxy: bulge
© The Authors 2023
 Open Access article, published by EDP Sciences, under the terms of the Creative Commons Attribution License (https://creativecommons.org/licenses/by/4.0), which permits unrestricted use, distribution, and reproduction in any medium, provided the original work is properly cited.
This article is published in open access under the Subscribe to Open model. This email address is being protected from spambots. You need JavaScript enabled to view it. to support open access publication.
1. Introduction
Karachentsev (2005) noted a peculiar connection between the abundance of dwarf galaxy satellites and the bulges of the host galaxy in nearby galaxy groups: the larger the central bulge of a galaxy, the more dwarf galaxies surrounded the galaxy. This is most evident in our own Local Group, where the Andromeda galaxy hosts a more massive bulge (Bell et al. 2017) as well as more dwarf galaxies (McConnachie 2012). This may not seem surprising, because the Andromeda galaxy is likely twice as massive as the Milky Way (Carlesi et al. 2022; Patel & Mandel 2023). It is well known that the number of dwarf galaxies is directly correlated to the mass of the central dark matter halo. However, for similar massive dark matter halos, a similar number of dwarf galaxies is expected (within a scatter; e.g., Müller et al. 2019; Samuel et al. 2020; Carlsten et al. 2021). Therefore, it is intriguing that Javanmardi et al. (2019) find no correlation between the bulge size of the central galaxy and the number of dwarf galaxies for a given mass in cosmological dark-matter-only simulations with semi-analytical galaxy formation models.
Using classifications of bulge sizes from the Galaxy Zoo citizen project (Willett et al. 2013) and a catalog of tidal dwarf galaxies (Kaviraj et al. 2012), López-Corredoira & Kroupa (2016) found a relation between the number of tidal dwarf galaxies and the size of the bulge for equal-mass host galaxies. They argue that such a relation is not expected in the standard model of cosmology (in line with later results from Javanmardi et al. 2019) but is expected in alternative gravity scenarios, such as modified Newtonian dynamics (MOND; Milgrom 1983); the latter, however, still needs a more quantitative analysis (some simulations of the formation of tidal dwarfs in MOND were done in, e.g., Tiret & Combes 2008; Bílek et al. 2018; Banik & Zhao 2018). While in a MOND context tidal dwarf galaxies and dwarf galaxies may have the same origin1, that is, they may form in tidal interactions, they are fundamentally different within Λ cold dark matter (ΛCDM), representing different generations of galaxies. Predicting the number of tidal dwarf galaxies in the standard ΛCDM model is difficult because high-resolution baryonic simulations in cosmological contexts are needed (Ploeckinger et al. 2018). The different origins of these dwarf galaxies in ΛCDM means that tidal dwarf galaxies cannot be used as tracers for the overall dwarf galaxy population (including primordial and tidal dwarf galaxies). Therefore, in standard cosmology, no conclusions based on the abundance of satellite galaxies and the bulge mass of the host can be drawn from tidal dwarf galaxies alone. There is no way around this other than to study the primordial dwarf galaxy populations in nearby groups, which is a difficult task due to their faintness and low surface brightness (e.g., Park et al. 2017; Habas et al. 2020; Collins et al. 2023).
Recent efforts have expanded our knowledge of satellite systems in the nearby universe. Multiple teams have searched for dwarf galaxies using different instruments, such as the Dark Energy Camera (Müller et al. 2015; Taylor et al. 2017; Müller & Jerjen 2020), the MegaCam (Chiboucas et al. 2009; Crnojević et al. 2016; Habas et al. 2020), the OmegaCam (Venhola et al. 2019; La Marca et al. 2022), the KMTNet (Byun et al. 2020; Fan et al. 2023), the Hyper Suprime Cam (Smercina et al. 2018; Okamoto et al. 2019; Bell et al. 2022; Crosby et al. 2023), the Dragonfly array (Merritt et al. 2014; Cohen et al. 2018), or even small amateur telescopes (Karachentsev et al. 2015; Javanmardi et al. 2016; Henkel et al. 2017). These efforts have uncovered a plethora of hitherto undetected dwarf galaxies.
Carlsten et al. (2020) exploited archival MegaCam data to survey ten nearby galaxy groups. Javanmardi & Kroupa (2020) used these data together with literature values to study the relation between the number of dwarf galaxy satellites and the bulge-to-total baryonic mass ratio (B/T). Because B/T is a mass ratio, it is not dependent on the total baryonic mass of the galaxy but rather gives an estimate about how prominent the bulge is. Using seven host galaxies, Javanmardi & Kroupa (2020) found a linear relation between B/T and the number of satellites. This seems to be at odds with cosmological ΛCDM predictions, as shown in Javanmardi et al. (2019), which adds to other small-scale problems (e.g., Boylan-Kolchin et al. 2011; Pawlowski et al. 2012; Cautun & Frenk 2017; Müller et al. 2021; van Dokkum et al. 2022, see also the reviews by Kroupa et al. 2010, Bullock & Boylan-Kolchin 2017, or Sales et al. 2022).
In this paper we test the relation between B/T and the number of satellites by increasing the number of studied systems by a factor of four compared to previous work. In Sect. 2 we present the data used in this work, in Sect. 3 we study the B/T to Nsat relation, in Sect. 4 we compare the data to TNG100 of the IllustrisTNG suite of simulations, and in Sect. 5 we give a summary and conclusions.
2. Data
We used the dwarf galaxy satellite catalog from Carlsten et al. (2022) – Exploration of Local VolumE Satellites (ELVES) – which is a combination of their own survey as well as a compilation of archival data (see the references under Table 1). ELVES represents a volume complete dwarf galaxy catalog within 10 Mpc. The detection completeness is MV = −9 mag based on artificial galaxy experiments. In total they provide data for 30 galaxies. We exclude the Milky way in our analysis, because the detection and completeness estimation is quite different than for external systems, leaving us a sample of 29 host galaxies. Carlsten et al. (2022) provide the positions of all dwarf galaxy satellites, as well as the survey footprint limit (rcover). The average radial coverage is 266 kpc, which is close to the radial selection of dwarf galaxies of 250 kpc used by Javanmardi & Kroupa (2020). We adopt the same cut of 250 kpc here. The systems contain between 3 and 66 dwarf galaxies. If we select only dwarf galaxies within 250 kpc, the abundance ranges between 3 and 40. In Table 1 we provide the numbers of satellites within 250 kpc (N250), but because not all systems cover this radial extent, we additionally apply corrections. This is the case for NGC 4258, NGC 4565, M 104, and NGC 5194 with a radial coverage of 150 kpc and NGC 4631, Cen A, and NGC 6744 with 200 kpc. To apply a correction we calculate the average difference between the number of dwarf galaxies for systems with a coverage larger than 250 kpc. We take two differences, one between 250 kpc and 150 kpc and one between 250 kpc and 200 kpc. The average difference is five and three dwarfs, respectively. By adding these to N250 of the incomplete systems (NGC 4258, NGC 4565, M 104, NGC 5194, Cen A, and NGC 6744) we get a corrected number of dwarf galaxies within 250 kpc ( ).
).
ELVES satellite systems.
We did not find an estimation of B/T in the literature for all galaxies in our sample. Where we did not find the number directly, we searched for the bulge mass and disk mass or luminosity individually and calculated the B/T ratio ourselves. This was the case for NGC 628, NGC 1023, and NGC 4826 where we converted the J band photometry of the bulge and the whole galaxy into stellar masses and adopted a conservative error of 30% on the B/T value. For NGC 1291 we found the spheroidal to total luminosity ratio of 0.57 (de Vaucouleurs 1975), without an error. We take this value as B/T and take an uncertainty of 30% on B/T. For NGC 1808, NGC 3344, NGC 4826, NGC 5055, NGC 5194, NGC 5457, and NGC 6744 the masses are given without uncertainties, so we assume an error of 15% on both the bulge and total mass. For NGC 4517 a B/T value of 0.02 is given with no uncertainty, which we set to 0.02 (i.e., consistent with no bulge). For M 104, a B/T value of 0.77 (Gadotti & Sánchez-Janssen 2012) is given without uncertainty. Because two other studies give a value of 0.77 and 0.73 for M 104, respectively (Bendo et al. 2006; Jardel et al. 2011), we take the mean and standard deviation of these three values as our B/T and the corresponding uncertainty. For four galaxies, no B/T ratio can be calculated, because they are either elliptical galaxies or have no visible bulge. For the former (NGC 3379) we assign a B/T ratio of 1, for the latter (NGC 3556, NGC 4631, and NGC 5236) a value of 0. We do not further distinguish between bulges and pseudo-bulges.
All properties used in this work are compiled in Table 1, as are the corresponding references (to our best knowledge).
3. The relation between the B/T and the number of dwarf satellites
In Fig. 1 we show the number of satellites N250 as a function of B/T. The data are color coded according to the stellar mass of the host galaxy. Looking at all data points, a positive correlation is clearly visible. A linear regression of the data finds a slope of 16.05 ± 3.99 and an intercept of 6.29 ± 1.15 for the uncorrected sample and 16.84 ± 3.88 and 7.57 ± 1.12 for the corrected sample, respectively. The errors correspond to the 1σ uncertainty. There are almost no differences whether we consider the corrected or the uncorrected values for the two fits. Therefore, we consider that the uncorrected abundance of dwarfs N250 represents the data well enough for the further discussion. The same is true if we only consider the 20 galaxies with a coverage of at least 250 kpc. The positive correlation remains with a slope of 16.72 ± 5.66 and an intercept of 6.89 ± 1.49. We conclude that the full sample represents the data well enough.
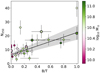 |
Fig. 1. Number of observed satellites as a function of the B/T. The dots correspond to the galaxy satellite systems, with their color representing the host stellar mass. The black line corresponds to the linear regression, the gray area to the 1σ uncertainty. |
To test whether there is a dependence on the stellar mass of the host galaxy, we color coded the stellar mass in Fig. 1 and split the sample in two with a mass cut at 1010.5 M⊙. This split results in the massive sample with 18 hosts and light sample with 11 hosts. For the massive sample, the slope and intercept are 21.20 ± 5.13 and 3.89 ± 1.83, and for the light sample it is 3.08 ± 8.96 and 8.80 ± 1.10. It is noteworthy that the correlation is driven by the more massive galaxies. When considering host galaxies with stellar masses below 1010.5, the slope is consistent with zero. This may come from the fact that this sample is likely under-sampled, as all galaxies have low B/T ratios, which is visible in Fig. 2, where we plot the number of satellites as a function of the stellar mass. More data are needed.
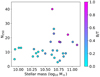 |
Fig. 2. Number of observed satellites as a function of the stellar mass of the host. The color coding represents the B/T ratio. |
To estimate the significance of the correlation between B/T and N250, we conducted a Monte Carlo simulation. For that, we ran for each of the three samples (all, larger 1010.5 M⊙, and smaller 1010.5 M⊙) 10 000 iterations where we kept B/T fixed and reassigned the number of satellites N250 for a given giant galaxy. For each iteration, we reevaluate the slope and intercept of the linear regression. The resulting slope and intercept distributions can be approximated with a normal distribution. Comparing the observed slope with these simulations, we measure standard deviations of 4.6σ, 3.6σ, and 0.4σ, respectively. This means that for the total sample and the massive sample, we find that the observed slope is significant (> 3.0σ), that is, there is a positive linear relation between B/T and N250. For the light sample, the observed slope is consistent with zero (< 1.0σ).
Another way to check whether the relation is significant is to calculate the Pearson correlation. Calculating this for the three samples, we get Pearson r values of 0.69, 0.69, and 0.02. A sample is perfectly correlated (or anticorrelated) if the Pearson r value is either −1 or 1 and uncorrelated with a value of 0. Generally, a Pearson value larger than 0.5 is interpreted as highly correlated and a value between 0.0 and 0.3 as mildly correlated. With observed values of 0.7 the full and massive samples are both highly correlated. With a value of 0.0 the light sample is uncorrelated. This gives a similar picture as before: the more massive galaxies follow a linear relation between the bulge to total stellar mass ratio and the number of dwarf galaxies associated with the system, while the less massive galaxies do not indicate a trend. Again, for the latter this could be due to a not well-sampled sample. It will be important to test more such galaxies with a large B/T ratio to see whether this persists. For the more massive galaxies, the picture looks more robust with a better overall sampling of B/T ratios.
We next wanted to determine if this relation is due to morphology. Five of the galaxies in our sample (NGC 1023, NGC 1291, M104, NGC 3115, and Cen A) are lenticular galaxies, and one is an elliptical galaxy (NGC 3379). Together, lenticular and elliptical galaxies are considered as early-type galaxies (ETGs). The ETGs in our sample populate, unsurprisingly, the high end of the B/T ratios. If we exclude these galaxies, that is to say, keep only the late-type galaxies (LTGs) and repeat the previous analysis, we get a slope of 8.51 ± 8.41 and an intercept of 7.14 ± 1.45, which is significant at a 1.2σ level based on the Monte Carlo runs. Being below 2σ, the LTG sample by itself is not significant, meaning that we do not find a clear relation between B/T and the number of satellites. This is obvious when considering the LTGs in Fig 3. Similarly, the Pearson correlation is 0.34, showing only a mild correlation. We note that the LTGs are not well sampled along the B/T ratios, with only one galaxy having a B/T ratio larger than 0.4. This galaxy – M 81 – however, has a larger abundance of dwarfs than the average of other LTGs with lower B/T ratios. The results somewhat increase when considering only the LTGs with stellar masses above 1010.5 M⊙ to a significance of 1.8σ and a Pearson correlation of 0.48, which is however still below the common detection threshold of 3σ. Because lenticular galaxies were former spiral galaxies that have undergone a morphological transformation through some mechanism, such as quenching (Moore et al. 1998; Liu et al. 2019), mergers (Borlaff et al. 2014), or a more complex multistage formation process (Buzzo et al. 2021), it is not clear what a fair sample selection would be. By including the lenticular galaxies, the relation between B/T and N250 is significant, by excluding them, it is not. This indicates that they are one of the drivers of the relation.
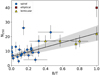 |
Fig. 3. Same as Fig. 1 but color coded according to morphology. The blue dots represent spiral galaxies, the orange triangles lenticular galaxies, and the red square the elliptical galaxy in our sample. |
4. Comparison to simulations
The comparison of the observed B/T to number of satellites relation to simulation was previously conducted with dark-matter-only simulations (Javanmardi et al. 2019), namely the Millennium-II simulation (Boylan-Kolchin et al. 2009), where dwarfs galaxies, bulges, and disks were “painted” to the dark matter halos based on semi-analytical models (Guo et al. 2011). These semi-analytical models may not represent realistic galaxies in a ΛCDM universe. Therefore, we reanalyzed the relation in a more modern cosmological simulation.
We extracted simulated galaxies from the Illustris TNG100-1 simulation (Nelson et al. 2019), a gravo-magnetohydrodynamical model simulating the growth of galaxies within a box of 106.5 Mpc side length, from time z ∼ 20 to z = 0 with baryonic mass resolution of 1.4 × 10⁶ M⊙ and dark matter mass resolution of 7.5 × 10⁶ M⊙. From this simulation, we select central host galaxies, defined as those halos considered to be the center of a galaxy group, with stellar masses between 9.9 < log10 M⊙ < 11.1 at z = 0. This range corresponds to the minimal and maximal stellar mass of the centrals in the ELVES catalog, respectively. To remove highly populated galaxy clusters, we then select only galaxy groups that consist of at most three galaxies with absolute magnitude Mg < −19.5. To remove dark halos, only subhalos with absolute magnitude Mg < −9 are selected. Finally, from these groups we select only subhalos within 250 kpc of the central host galaxy. We then use the supplementary catalog provided by Genel et al. (2015) to determine the bulge to stellar mass ratio for each central galaxy, where this ratio is the mass fraction of stars that have circularity parameter ϵ < 0 multiplied by 2. One caveat with this catalog is that each galaxy does contain a bulge. The smallest B/T ratio in the selected TNG100 analogs is 0.08, while the observed catalog contains galaxies with B/T ratios equal to zero.
Figure 4 shows the number of subhalos contained within each of the TNG100 analogs against the bulge mass ratio of the central halos of those analogs. Because we found that morphology drives the observed relation, we furthermore show quenched and unquenched central galaxies separately. We use a star formation rate threshold of 0.1 M⊙ per year to separate between quenched and unquenched halos, representing the ETGs and LTGs, respectively. And finally, we again make the split between the massive (> 1010.5 M⊙) and light (< 1010.5 M⊙) sample. Contrary to previous studies based on the Millennium-II simulation, we do find a positive trend between the number of subhalos and the B/T ratio. We fit linear functions to these samples using a density-based weighting for imbalanced regression (Steininger et al. 2021). This weighting is necessary because the data are unevenly distributed. Repeating the significance tests, we find the slopes to be significant well above the 3σ level except for one sample at 2.6σ. Only for unquenched central halos with a stellar mass < 1010.5 M⊙ we do not find a significant trend. This is also visible in Fig. 4, where all samples except this one show a significant slope. We note that galaxies with stellar masses below 1010.5 M⊙ are not well represented in our observed sample with respect to their B/T distribution. Therefore, for the purpose of comparing observations and simulations, we deem the massive sample with > 1010.5 M⊙ in stellar mass more appropriate. This also becomes apparent when we compare the B/T distribution of the TNG100 analogs (see Fig. 5), where for stellar masses below 1010.5 M⊙ the B/T ratios of the observed galaxies is not well sampled, with B/T ratios close to zero. For analogs more massive than 1010.5 M⊙, the observed galaxies span the same range as the TNG100 galaxies.
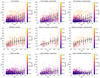 |
Fig. 4. Number of subhalos as a function of the B/T in TNG100. The colored dots correspond to the central halos and their subhalo systems, with their color representing the central halo’s stellar mass. To demonstrate the distribution of the data for a given B/T, we use a binning scheme. The black dots and uncertainties give the mean in these bins and the lines the 1σ standard deviation. The gray line corresponds to the linear regression to all the TNG100 halos in our sample, and the gray area to the 1σ uncertainty. We show the full sample (top), the massive sample, (middle), and the light sample (bottom) as well as the corresponding sample (left), the quenched sample (middle), and the unquenched sample (right). |
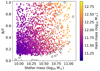 |
Fig. 5. Stellar mass to B/T distribution of TNG100 galaxies and the observed groups. Color-coded dots are the TNG100 galaxies, with the color representing their halo mass. The white dots represent the ELVES galaxies. |
To conclude from this analysis, we do find a significant positive correlation between the number of subhalos and the ratio between the bulge to total stellar mass in TNG100.
5. Summary and conclusions
In the past, it was suggested that a correlation existed between the number of dwarf galaxy satellites and the size of the bulge of the central galaxies, which may be inconsistent with ΛCDM cosmology. In this work, we tested this with a complete catalog of satellite systems within the nearby universe. Using 29 galaxy groups, we find that there indeed exists a linear relation at the 4σ level between the number of satellites and the bulge to total stellar mass of the host, as previously suggested by Javanmardi & Kroupa (2020) based on a total of seven systems. We did not use two of their systems – namely the Milky Way, due to a dwarf galaxy detection methodology that is different from that of the rest of our sample, and M 33, which has a lower stellar mass than what we consider here – so our sample can be considered a – somewhat – different data set. Because in our analysis we used host galaxies with similar stellar masses, the signal is not driven by the well-known relation between the halo mass and the number of satellites.
We wanted to determine whether the relation between the B/T ratio and the number of satellites was driven by morphology. In our sample we have both ETGs (6) and LTGs (23). The ETGs – more specifically, the five lenticular galaxies – seem to be the drivers of the relation at the high B/T end. These galaxies have stellar masses similar to the those of the majority of the LTGs in our sample and should therefore, naively, not host more dwarf galaxies. Excluding these ETGs from our sample, the relation between the B/T and the number of satellites vanishes; however, the B/T range is not well sampled, with only one LTG having a B/T ratio larger than 0.4. This LTG – M 81 – hosts more satellites than the rest of LTGs, leading us to wonder whether this is just a coincidence.
Lenticular galaxies are somewhere between spirals and ellipticals, and they undergo a morphological transformation. It is therefore not clear whether removing them from the sample is fair or even useful. Assuming the relation between the B/T ratio and the number of satellites is real, their morphology may give us clues to the origin of the relation. One speculative idea is that major mergers may be responsible for the large number of satellites as well as the buildup of the central bulge. The lenticular galaxy Cen A underwent a major merger 2 Gyr ago; the mass ratio of its progenitors was as high as 1.5 (Wang et al. 2020). Cen A has a stellar mass of 8 × 10¹⁰ M⊙ and 22 known satellites within N250. By assuming that both progenitors have stellar masses between 3 and 5 × 10¹⁰ M⊙ we can guess how many dwarf galaxies each of them would bring with them. Eight central galaxies are in this stellar mass range in the ELVES catalog, with a median of 14 dwarf galaxies, so the combined satellite population of two of these progenitor galaxies (i.e., 28 dwarf galaxies) would be consistent with the number of observed satellites around Cen A (N250 = 22). Of course, this simplified assessment does not take any mass loss or star formation during the merger into account, nor any disruption of dwarf galaxies, but may still point toward an explanation of this empirical relation. The M 81 system provides further arguments for this interpretation. For M 81 there is evidence for ongoing gas stripping with NGC 3077 (Yun et al. 1994), a dwarf elliptical on the more massive end. M 81 is transforming into a lenticular galaxy with a sluggish star formation rate (0.25 M⊙ yr−1, Lehmer et al. 2019). The M 81 group also possesses M 82 within its virial radius. M 82 is a starburst galaxy with a stellar mass of 1010.5 M⊙. M 81 could have acquired satellites from M 82, boosting its abundance of dwarf galaxies, as we hypothesized for Cen A. Ultimately, however, this scenario would need to be quantified by simulations of mergers.
Because the catalog is limited by a 10 Mpc cut, there is not much room for the data catalog to be improved. Therefore, to increase the sample we need to include more distant galaxies. Within 10–40 Mpc, deep targeted observations are capable of detecting dwarf galaxies to limits similar to those discussed here, and wide surveys such as Euclid or LSST will increase the sample a great deal. This will help us better sample the different B/T ratios, especially at larger values. It will be particularly interesting to sample spiral galaxies with high B/T values to see whether the observed relation is driven by morphology or not.
Javanmardi et al. (2019) found that a relation between the size of the bulge of the central galaxies and its satellite population is not expected in standard cosmology. However, Javanmardi et al. (2019) used the Millennium-II simulation, which is a dark-matter-only simulation. Because this simulation does not include baryonic physics, semi-analytical models were applied to “paint” bulges and disks to dark matter halos, which may not represent realistic galaxies. Here, we instead used the TNG100 simulation that includes baryonic physics to reevaluate the findings from Javanmardi et al. (2019). Contrary to the findings from the Millennium-II simulation, there is a correlation between the bulge to disk ratio and the number of subhalos, this is, dwarf galaxy satellites. This indicates that ΛCDM generally does produce something like the observed relation. We investigated if there is a dependence on the stellar mass of the host galaxy and/or the star formation rate. By splitting the TNG100 analogs into a massive and light sample, as well as a quenched and unquenched sample, we investigated the appearance of a correlation between the bulge to disk ratio and the number of subhalos. For all but the unquenched sample with stellar masses below 1010.5 M⊙, we find a significant positive trend. For the unquenched sample in this mass range, the Pearson correlation suggests a weak correlation; however, fitting a linear function gives a slope consistent with zero. This sample, however, is not well represented in the ELVES catalog.
As a caveat to the analysis, we want to point out that in ΛCDM the number of subhalos is driven by the halo mass, which is a property that we have access to in simulations but is difficult to measure in galaxy groups, with large uncertainties for even well-studied systems (e.g., Karachentsev 2005; Müller et al. 2022). As a proxy, we used the stellar mass of the host galaxy, which is related to the halo mass via the stellar-to-halo mass relation. This relation has a scatter of roughly 0.2 dex (e.g., Reddick et al. 2013; Kravtsov et al. 2018), which we did not consider here. For future work, a systematic study of the halo masses of the ELVES target could provide new insights.
In general, TNG100 seems to produce a positive correlation between the number of satellites and the bulge to total stellar mass ratio. We conclude that the observed empirical relation may not be in tension with standard ΛCDM cosmology after all.
Currently, the formation of dwarf galaxies in MOND has only been simulated through tidal interactions, but this is due to the construction of the simulation. To date, no MOND cosmology exists; therefore, the nature and origin of dwarf galaxies in MOND is unknown.
Acknowledgments
We thank the referee for the constructive report, which helped to clarify and improve the manuscript. O.M. thanks Eva Schnider for helpful discussions on the fitting and visualization of the TNG100 data. O.M. also thanks Benoit Famaey for discussions on the origin of dwarf galaxies in MOND. O.M. is grateful to the Swiss National Science Foundation for financial support under the grant number PZ00P2_202104.
References
- Audibert, A., Combes, F., García-Burillo, S., et al. 2021, A&A, 656, A60 [NASA ADS] [CrossRef] [EDP Sciences] [Google Scholar]
- Banik, I., & Zhao, H. 2018, MNRAS, 473, 4033 [NASA ADS] [CrossRef] [Google Scholar]
- Bell, E. F., Monachesi, A., Harmsen, B., et al. 2017, ApJ, 837, L8 [NASA ADS] [CrossRef] [Google Scholar]
- Bell, E. F., Smercina, A., Price, P. A., et al. 2022, ApJ, 937, L3 [NASA ADS] [CrossRef] [Google Scholar]
- Bendo, G. J., Buckalew, B. A., Dale, D. A., et al. 2006, ApJ, 645, 134 [NASA ADS] [CrossRef] [Google Scholar]
- Bennet, P., Sand, D. J., Crnojević, D., et al. 2019, ApJ, 885, 153 [NASA ADS] [CrossRef] [Google Scholar]
- Bílek, M., Thies, I., Kroupa, P., & Famaey, B. 2018, A&A, 614, A59 [Google Scholar]
- Borlaff, A., Eliche-Moral, M. C., Rodríguez-Pérez, C., et al. 2014, A&A, 570, A103 [NASA ADS] [CrossRef] [EDP Sciences] [Google Scholar]
- Boylan-Kolchin, M., Springel, V., White, S. D. M., Jenkins, A., & Lemson, G. 2009, MNRAS, 398, 1150 [Google Scholar]
- Boylan-Kolchin, M., Bullock, J. S., & Kaplinghat, M. 2011, MNRAS, 415, L40 [NASA ADS] [CrossRef] [Google Scholar]
- Bullock, J. S., & Boylan-Kolchin, M. 2017, ARA&A, 55, 343 [Google Scholar]
- Buzzo, M. L., Cortesi, A., Hernandez-Jimenez, J. A., et al. 2021, MNRAS, 504, 2146 [NASA ADS] [CrossRef] [Google Scholar]
- Byun, W., Sheen, Y.-K., Park, H. S., et al. 2020, ApJ, 891, 18 [NASA ADS] [CrossRef] [Google Scholar]
- Carlesi, E., Hoffman, Y., & Libeskind, N. I. 2022, MNRAS, 513, 2385 [Google Scholar]
- Carlsten, S. G., Greco, J. P., Beaton, R. L., & Greene, J. E. 2020, ApJ, 891, 144 [NASA ADS] [CrossRef] [Google Scholar]
- Carlsten, S. G., Greene, J. E., Peter, A. H. G., Beaton, R. L., & Greco, J. P. 2021, ApJ, 908, 109 [NASA ADS] [CrossRef] [Google Scholar]
- Carlsten, S. G., Greene, J. E., Beaton, R. L., Danieli, S., & Greco, J. P. 2022, ApJ, 933, 47 [CrossRef] [Google Scholar]
- Carrillo, A., Bell, E. F., Bailin, J., et al. 2017, MNRAS, 465, 5026 [NASA ADS] [CrossRef] [Google Scholar]
- Cautun, M., & Frenk, C. S. 2017, MNRAS, 468, L41 [NASA ADS] [CrossRef] [Google Scholar]
- Chiboucas, K., Karachentsev, I. D., & Tully, R. B. 2009, AJ, 137, 3009 [Google Scholar]
- Chiboucas, K., Jacobs, B. A., Tully, R. B., & Karachentsev, I. D. 2013, AJ, 146, 126 [Google Scholar]
- Cohen, Y., van Dokkum, P., Danieli, S., et al. 2018, ApJ, 868, 96 [Google Scholar]
- Collins, M. L. M., Karim, N., Martinez-Delgado, D., et al. 2023, MNRAS, submitted [arXiv:2305.13966] [Google Scholar]
- Crnojević, D., Sand, D. J., Caldwell, N., et al. 2014, ApJ, 795, L35 [CrossRef] [Google Scholar]
- Crnojević, D., Sand, D. J., Spekkens, K., et al. 2016, ApJ, 823, 19 [Google Scholar]
- Crnojević, D., Sand, D. J., Bennet, P., et al. 2019, ApJ, 872, 80 [Google Scholar]
- Crosby, E., Jerjen, H., Müller, O., et al. 2023, MNRAS, 521, 4009 [Google Scholar]
- Danieli, S., van Dokkum, P., Merritt, A., et al. 2017, ApJ, 837, 136 [NASA ADS] [CrossRef] [Google Scholar]
- de Vaucouleurs, G. 1975, ApJS, 29, 193 [Google Scholar]
- Fan, T. J., Moon, D.-S., Park, H. S., et al. 2023, MNRAS, 525, 4904 [Google Scholar]
- Fisher, D. B., Drory, N., & Fabricius, M. H. 2009, ApJ, 697, 630 [CrossRef] [Google Scholar]
- Gadotti, D. A., & Sánchez-Janssen, R. 2012, MNRAS, 423, 877 [NASA ADS] [CrossRef] [Google Scholar]
- Genel, S., Fall, S. M., Hernquist, L., et al. 2015, ApJ, 804, L40 [NASA ADS] [CrossRef] [Google Scholar]
- Goudfrooij, P., Strader, J., Brenneman, L., et al. 2003, MNRAS, 343, 665 [Google Scholar]
- Guo, Q., White, S., Boylan-Kolchin, M., et al. 2011, MNRAS, 413, 101 [Google Scholar]
- Habas, R., Marleau, F. R., Duc, P.-A., et al. 2020, MNRAS, 491, 1901 [NASA ADS] [Google Scholar]
- Henkel, C., Javanmardi, B., Martínez-Delgado, D., Kroupa, P., & Teuwen, K. 2017, A&A, 603, A18 [NASA ADS] [CrossRef] [EDP Sciences] [Google Scholar]
- Jardel, J. R., Gebhardt, K., Shen, J., et al. 2011, ApJ, 739, 21 [NASA ADS] [CrossRef] [Google Scholar]
- Javanmardi, B., & Kroupa, P. 2020, MNRAS, 493, L44 [NASA ADS] [CrossRef] [Google Scholar]
- Javanmardi, B., Martinez-Delgado, D., Kroupa, P., et al. 2016, A&A, 588, A89 [NASA ADS] [CrossRef] [EDP Sciences] [Google Scholar]
- Javanmardi, B., Raouf, M., Khosroshahi, H. G., et al. 2019, ApJ, 870, 50 [NASA ADS] [CrossRef] [Google Scholar]
- Karachentsev, I. D. 2005, AJ, 129, 178 [NASA ADS] [CrossRef] [Google Scholar]
- Karachentsev, I. D., Riepe, P., Zilch, T., et al. 2015, Astrophys. Bull., 70, 379 [NASA ADS] [CrossRef] [Google Scholar]
- Kaviraj, S., Darg, D., Lintott, C., Schawinski, K., & Silk, J. 2012, MNRAS, 419, 70 [NASA ADS] [CrossRef] [Google Scholar]
- Kravtsov, A. V., Vikhlinin, A. A., & Meshcheryakov, A. V. 2018, Astron. Lett., 44, 8 [Google Scholar]
- Kroupa, P., Famaey, B., de Boer, K. S., et al. 2010, A&A, 523, A32 [NASA ADS] [CrossRef] [EDP Sciences] [Google Scholar]
- La Marca, A., Iodice, E., Cantiello, M., et al. 2022, A&A, 665, A105 [NASA ADS] [CrossRef] [EDP Sciences] [Google Scholar]
- Lehmer, B. D., Eufrasio, R. T., Tzanavaris, P., et al. 2019, ApJS, 243, 3 [NASA ADS] [CrossRef] [Google Scholar]
- Liu, C., Hao, L., Wang, H., & Yang, X. 2019, ApJ, 878, 69 [NASA ADS] [CrossRef] [Google Scholar]
- López-Corredoira, M., & Kroupa, P. 2016, ApJ, 817, 75 [CrossRef] [Google Scholar]
- Martin, N. F., Ibata, R. A., McConnachie, A. W., et al. 2013, ApJ, 776, 80 [NASA ADS] [CrossRef] [Google Scholar]
- McConnachie, A. W. 2012, AJ, 144, 4 [Google Scholar]
- Merritt, A., van Dokkum, P., & Abraham, R. 2014, ApJ, 787, L37 [NASA ADS] [CrossRef] [Google Scholar]
- Milgrom, M. 1983, ApJ, 270, 365 [Google Scholar]
- Möllenhoff, C., & Heidt, J. 2001, A&A, 368, 16 [NASA ADS] [CrossRef] [EDP Sciences] [Google Scholar]
- Moore, B., Lake, G., & Katz, N. 1998, ApJ, 495, 139 [Google Scholar]
- Müller, O., & Jerjen, H. 2020, A&A, 644, A91 [NASA ADS] [CrossRef] [EDP Sciences] [Google Scholar]
- Müller, O., Jerjen, H., & Binggeli, B. 2015, A&A, 583, A79 [NASA ADS] [CrossRef] [EDP Sciences] [Google Scholar]
- Müller, O., Jerjen, H., & Binggeli, B. 2017a, A&A, 597, A7 [NASA ADS] [CrossRef] [EDP Sciences] [Google Scholar]
- Müller, O., Scalera, R., Binggeli, B., & Jerjen, H. 2017b, A&A, 602, A119 [NASA ADS] [CrossRef] [EDP Sciences] [Google Scholar]
- Müller, O., Rejkuba, M., & Jerjen, H. 2018, A&A, 615, A96 [NASA ADS] [CrossRef] [EDP Sciences] [Google Scholar]
- Müller, O., Rejkuba, M., Pawlowski, M. S., et al. 2019, A&A, 629, A18 [Google Scholar]
- Müller, O., Pawlowski, M. S., Lelli, F., et al. 2021, A&A, 645, L5 [NASA ADS] [CrossRef] [EDP Sciences] [Google Scholar]
- Müller, O., Lelli, F., Famaey, B., et al. 2022, A&A, 662, A57 [NASA ADS] [CrossRef] [EDP Sciences] [Google Scholar]
- Nelson, D., Springel, V., Pillepich, A., et al. 2019, Comput. Astrophys. Cosmol., 6, 2 [Google Scholar]
- Okamoto, S., Arimoto, N., Ferguson, A. M. N., et al. 2019, ApJ, 884, 128 [NASA ADS] [CrossRef] [Google Scholar]
- Park, H. S., Moon, D.-S., Zaritsky, D., et al. 2017, ApJ, 848, 19 [NASA ADS] [CrossRef] [Google Scholar]
- Patel, E., & Mandel, K. S. 2023, ApJ, 948, 104 [NASA ADS] [CrossRef] [Google Scholar]
- Pawlowski, M. S., Pflamm-Altenburg, J., & Kroupa, P. 2012, MNRAS, 423, 1109 [NASA ADS] [CrossRef] [Google Scholar]
- Ploeckinger, S., Sharma, K., Schaye, J., et al. 2018, MNRAS, 474, 580 [Google Scholar]
- Reddick, R. M., Wechsler, R. H., Tinker, J. L., & Behroozi, P. S. 2013, ApJ, 771, 30 [Google Scholar]
- Sales, L. V., Wetzel, A., & Fattahi, A. 2022, Nat. Astron., 6, 897 [NASA ADS] [CrossRef] [Google Scholar]
- Samuel, J., Wetzel, A., Tollerud, E., et al. 2020, MNRAS, 491, 1471 [NASA ADS] [CrossRef] [Google Scholar]
- Smercina, A., Bell, E. F., Price, P. A., et al. 2018, ApJ, 863, 152 [NASA ADS] [CrossRef] [Google Scholar]
- Steininger, M., Kobs, K., Davidson, P., Krause, A., & Hotho, A. 2021, Mach. Learn., 110, 2187 [Google Scholar]
- Taylor, M. A., Puzia, T. H., Muñoz, R. P., et al. 2017, MNRAS, 469, 3444 [NASA ADS] [CrossRef] [Google Scholar]
- Tiret, O., & Combes, F. 2008, ASP Conf. Ser., 396, 259 [Google Scholar]
- van Dokkum, P., Shen, Z., Keim, M. A., et al. 2022, Nature, 605, 435 [NASA ADS] [CrossRef] [Google Scholar]
- Venhola, A., Peletier, R., Laurikainen, E., et al. 2019, A&A, 625, A143 [EDP Sciences] [Google Scholar]
- Verdes-Montenegro, L., Bosma, A., & Athanassoula, E. 2000, A&A, 356, 827 [NASA ADS] [Google Scholar]
- Vollmer, B., Nehlig, F., & Ibata, R. 2016, A&A, 586, A98 [NASA ADS] [CrossRef] [EDP Sciences] [Google Scholar]
- Wang, J., Hammer, F., Rejkuba, M., Crnojević, D., & Yang, Y. 2020, MNRAS, 498, 2766 [NASA ADS] [CrossRef] [Google Scholar]
- Willett, K. W., Lintott, C. J., Bamford, S. P., et al. 2013, MNRAS, 435, 2835 [Google Scholar]
- Yun, M. S., Ho, P. T. P., & Lo, K. Y. 1994, Nature, 372, 530 [NASA ADS] [CrossRef] [Google Scholar]
All Tables
All Figures
|
Fig. 1. Number of observed satellites as a function of the B/T. The dots correspond to the galaxy satellite systems, with their color representing the host stellar mass. The black line corresponds to the linear regression, the gray area to the 1σ uncertainty. |
| In the text | |
|
Fig. 2. Number of observed satellites as a function of the stellar mass of the host. The color coding represents the B/T ratio. |
| In the text | |
|
Fig. 3. Same as Fig. 1 but color coded according to morphology. The blue dots represent spiral galaxies, the orange triangles lenticular galaxies, and the red square the elliptical galaxy in our sample. |
| In the text | |
|
Fig. 4. Number of subhalos as a function of the B/T in TNG100. The colored dots correspond to the central halos and their subhalo systems, with their color representing the central halo’s stellar mass. To demonstrate the distribution of the data for a given B/T, we use a binning scheme. The black dots and uncertainties give the mean in these bins and the lines the 1σ standard deviation. The gray line corresponds to the linear regression to all the TNG100 halos in our sample, and the gray area to the 1σ uncertainty. We show the full sample (top), the massive sample, (middle), and the light sample (bottom) as well as the corresponding sample (left), the quenched sample (middle), and the unquenched sample (right). |
| In the text | |
|
Fig. 5. Stellar mass to B/T distribution of TNG100 galaxies and the observed groups. Color-coded dots are the TNG100 galaxies, with the color representing their halo mass. The white dots represent the ELVES galaxies. |
| In the text | |
Current usage metrics show cumulative count of Article Views (full-text article views including HTML views, PDF and ePub downloads, according to the available data) and Abstracts Views on Vision4Press platform.
Data correspond to usage on the plateform after 2015. The current usage metrics is available 48-96 hours after online publication and is updated daily on week days.
Initial download of the metrics may take a while.