Open Access
Fig. 5.
Download original image
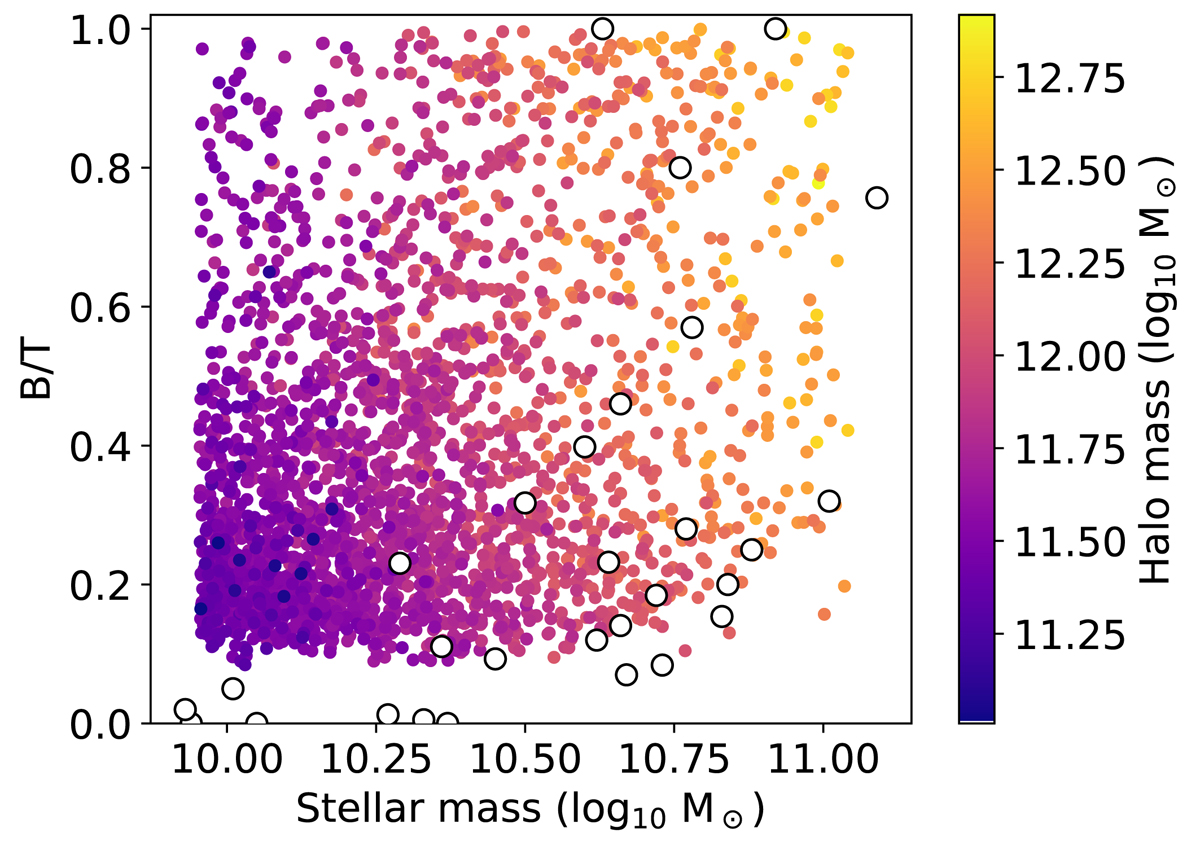
Stellar mass to B/T distribution of TNG100 galaxies and the observed groups. Color-coded dots are the TNG100 galaxies, with the color representing their halo mass. The white dots represent the ELVES galaxies.
Current usage metrics show cumulative count of Article Views (full-text article views including HTML views, PDF and ePub downloads, according to the available data) and Abstracts Views on Vision4Press platform.
Data correspond to usage on the plateform after 2015. The current usage metrics is available 48-96 hours after online publication and is updated daily on week days.
Initial download of the metrics may take a while.