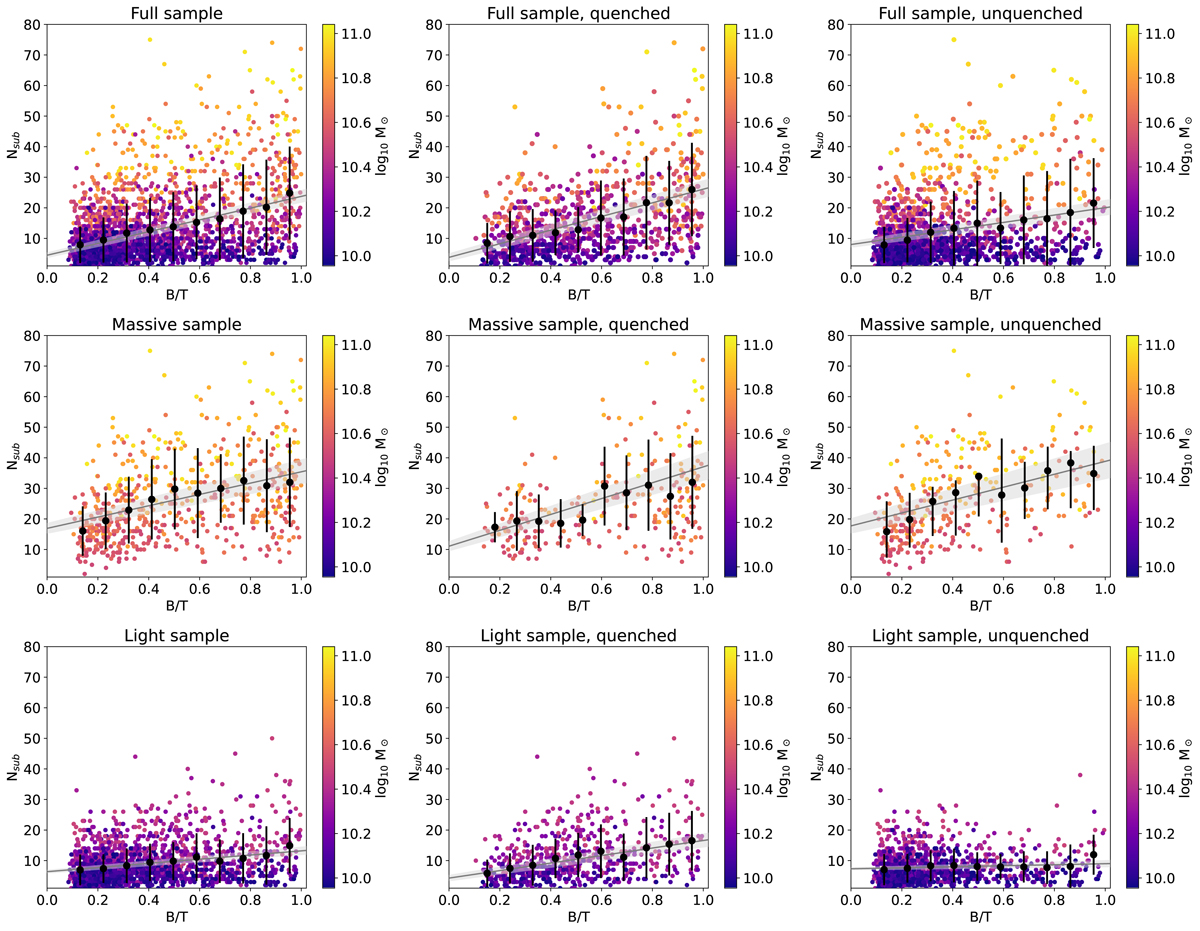
Fig. 4.
Download original image
Number of subhalos as a function of the B/T in TNG100. The colored dots correspond to the central halos and their subhalo systems, with their color representing the central halo’s stellar mass. To demonstrate the distribution of the data for a given B/T, we use a binning scheme. The black dots and uncertainties give the mean in these bins and the lines the 1σ standard deviation. The gray line corresponds to the linear regression to all the TNG100 halos in our sample, and the gray area to the 1σ uncertainty. We show the full sample (top), the massive sample, (middle), and the light sample (bottom) as well as the corresponding sample (left), the quenched sample (middle), and the unquenched sample (right).
Current usage metrics show cumulative count of Article Views (full-text article views including HTML views, PDF and ePub downloads, according to the available data) and Abstracts Views on Vision4Press platform.
Data correspond to usage on the plateform after 2015. The current usage metrics is available 48-96 hours after online publication and is updated daily on week days.
Initial download of the metrics may take a while.