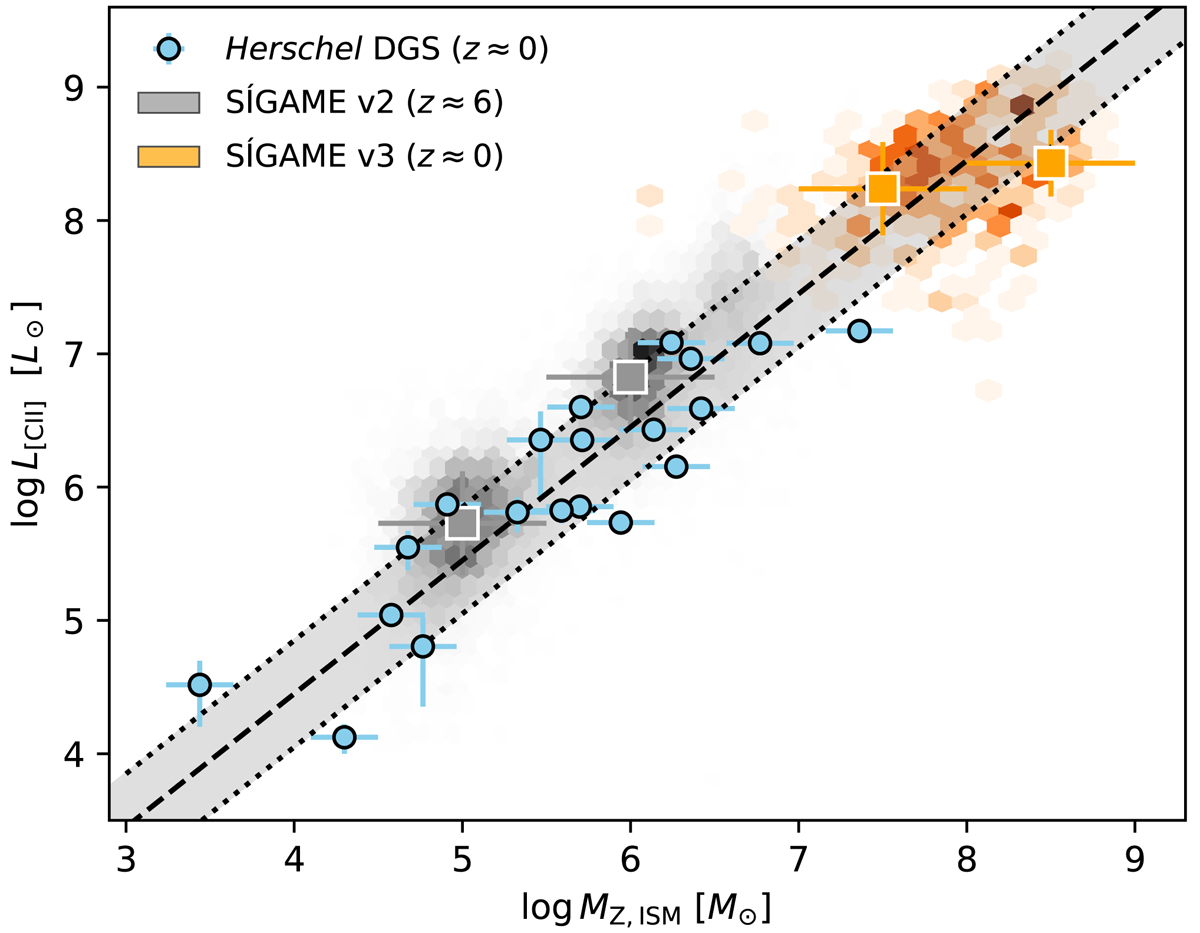
Fig. 1.
Download original image
Metal mass, MZ, ISM, vs. [C II] luminosity, L[CII]. The observed galaxy samples at z ≈ 0 (see text) with direct measurements of MZ, ISM and L[CII] are shown by the blue circles. The grey- and orange-shaded 2D hexagonal histograms represent simulated galaxies from SÍGAME-v2 (z ≈ 6) and v3 (z ≈ 0), and their mean and 1σ distributions are marked by the grey and orange squares respectively. The dashed line indicates the best-fit relation log(MZ, ISM/M⊙) = log(L[CII]/L⊙)−0.45 between all data sets and the grey-shaded region indicates the 0.4 dex rms scatter.
Current usage metrics show cumulative count of Article Views (full-text article views including HTML views, PDF and ePub downloads, according to the available data) and Abstracts Views on Vision4Press platform.
Data correspond to usage on the plateform after 2015. The current usage metrics is available 48-96 hours after online publication and is updated daily on week days.
Initial download of the metrics may take a while.