Fig. 1.

Download original image
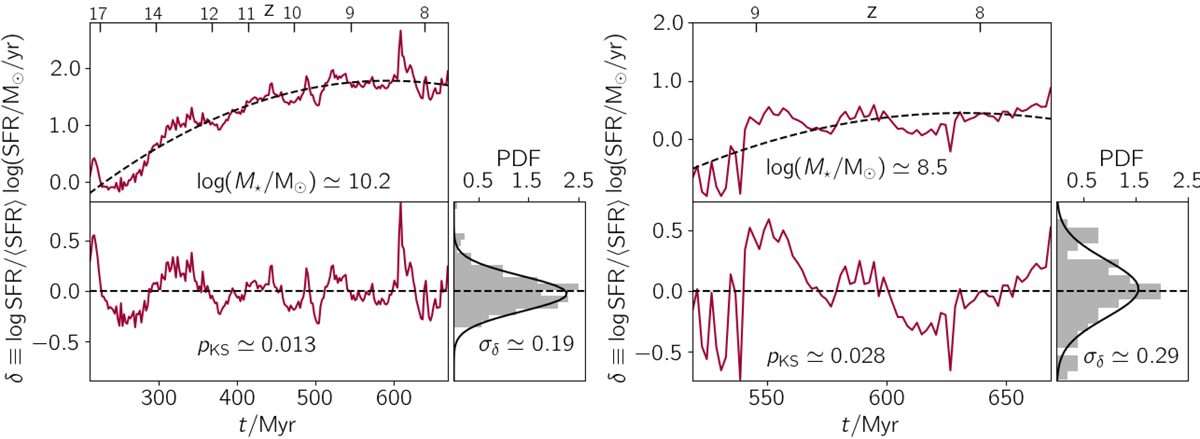
Example of SFH fitting and variability definitions for high-mass (log M⋆/M⊙ ≃ 10.2, left panel) and low-mass galaxies (log M⋆/M⊙ ≃ 8.5, right panel) in the SERRA simulation at z = 7.7. For each galaxy, we plot the star formation (SFR) in the upper panel as a function of cosmic time (t) and its fit (⟨SFR⟩, Eq. (1)) as a continuous and dashed line, respectively. We report the SFR starting from the time when the galaxy has a stellar mass higher than 106.5 M⊙, the SFR is averaged in temporal bins of 2 Myr, and on the upper axis, we plot the redshift (z). In the lower left panel, we plot the variation (δ, Eq. (2)) as a function of time, add a constant line for no variation (δ = 0) to guide the eye, and report the p-value from the Kolmogorov–Smirnov test (pKS) for the fit. In the lower right inset, we show the PDF of the variation, along with its Gaussian fit and standard deviation (σδ).
Current usage metrics show cumulative count of Article Views (full-text article views including HTML views, PDF and ePub downloads, according to the available data) and Abstracts Views on Vision4Press platform.
Data correspond to usage on the plateform after 2015. The current usage metrics is available 48-96 hours after online publication and is updated daily on week days.
Initial download of the metrics may take a while.


