Fig. D.1
Download original image
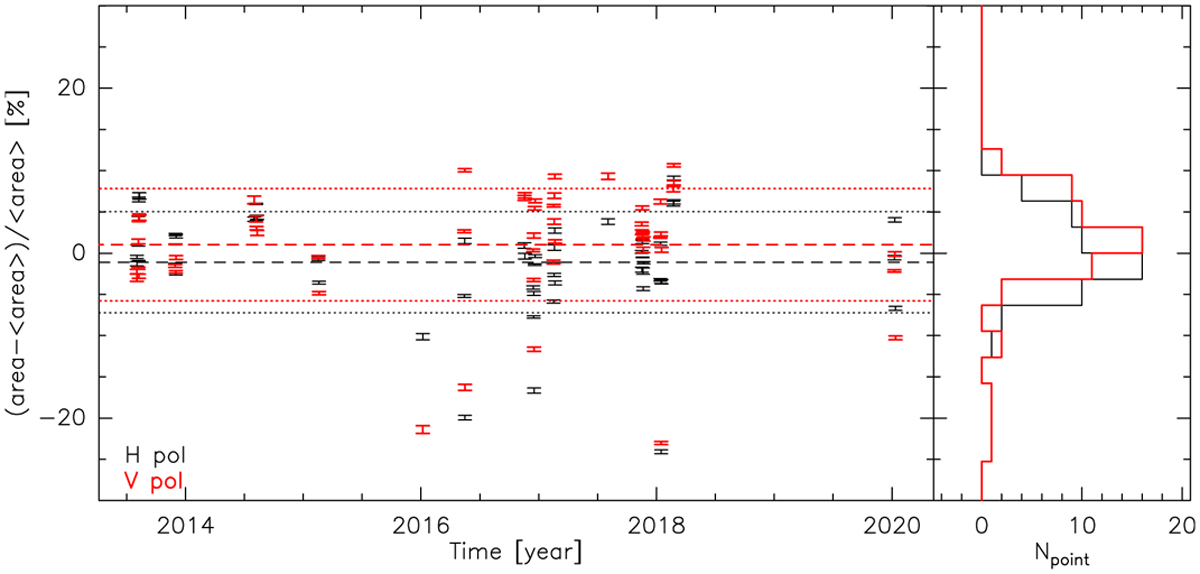
Relative variation of the fitted Gaussian area for the 13CO (1–0) line toward the Horsehead core in percentage. The left panel shows the variations as a function of the time of the measurements, while the right panel shows the histogram of the variations. The black and red colors are used for the H and V polarizations of the EMIR receiver. The vertical error bars around each point show the uncertainties on the fitted area due to thermal noise. The horizontal dashed lines show the mean variation for each polarization. The horizontal dotted lines show the ± 1σ level for all the measurements.
Current usage metrics show cumulative count of Article Views (full-text article views including HTML views, PDF and ePub downloads, according to the available data) and Abstracts Views on Vision4Press platform.
Data correspond to usage on the plateform after 2015. The current usage metrics is available 48-96 hours after online publication and is updated daily on week days.
Initial download of the metrics may take a while.