Fig. 18
Download original image
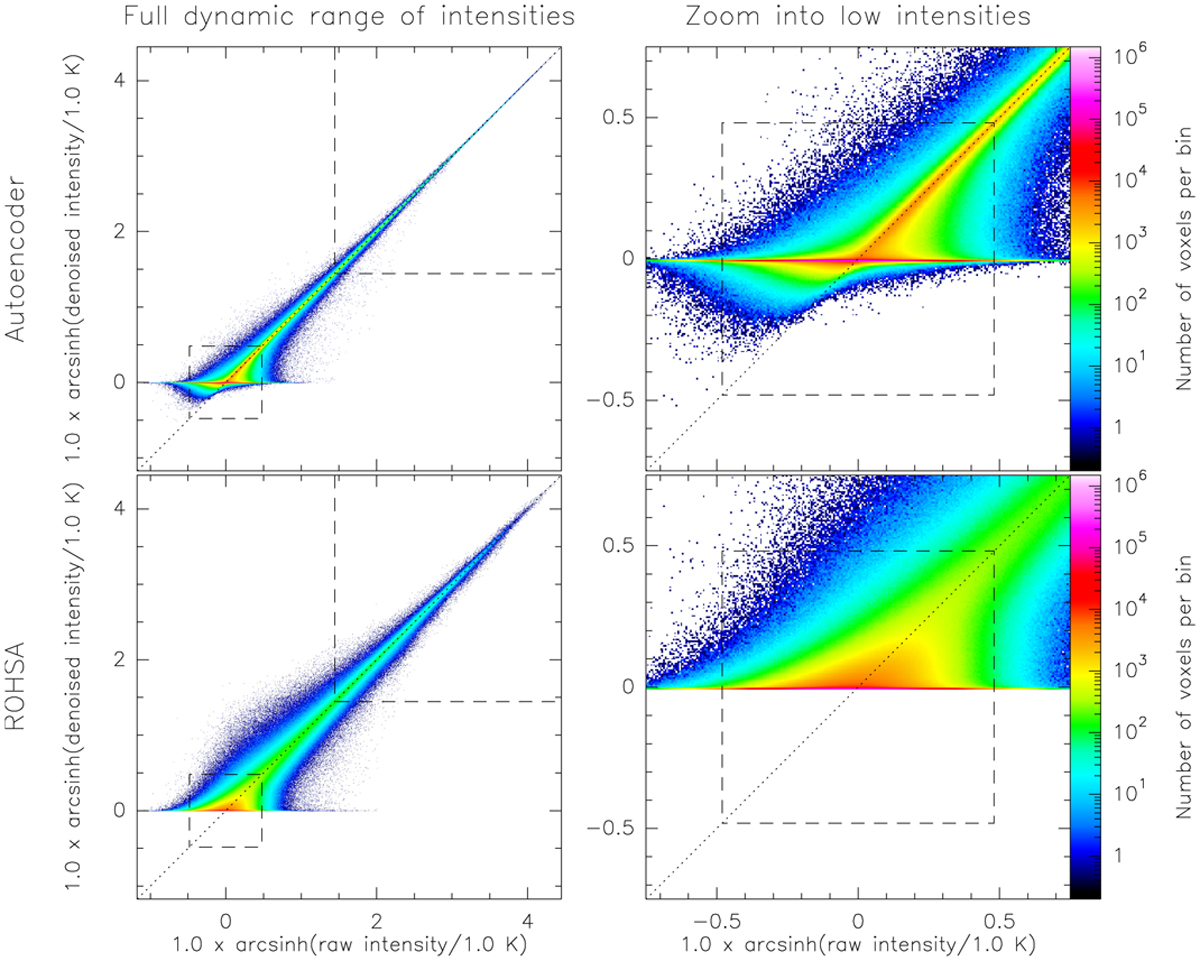
Comparison of the denoising performances of the taylored autoencoder (top) and ROHSA (bottom). Each panel shows the joint histogram of the denoised intensities vs. the data intensities. The left and right columns display the full dynamic range of intensities and a zoom into the low intensities. A arcsinh transform was applied in order to show the intensities below 5σ (lower dashed square) with a linear scale and above 20σ with a logarithm scale (upper dashed square). The dotted line highlights the identity function.
Current usage metrics show cumulative count of Article Views (full-text article views including HTML views, PDF and ePub downloads, according to the available data) and Abstracts Views on Vision4Press platform.
Data correspond to usage on the plateform after 2015. The current usage metrics is available 48-96 hours after online publication and is updated daily on week days.
Initial download of the metrics may take a while.