Fig. 9.
Download original image
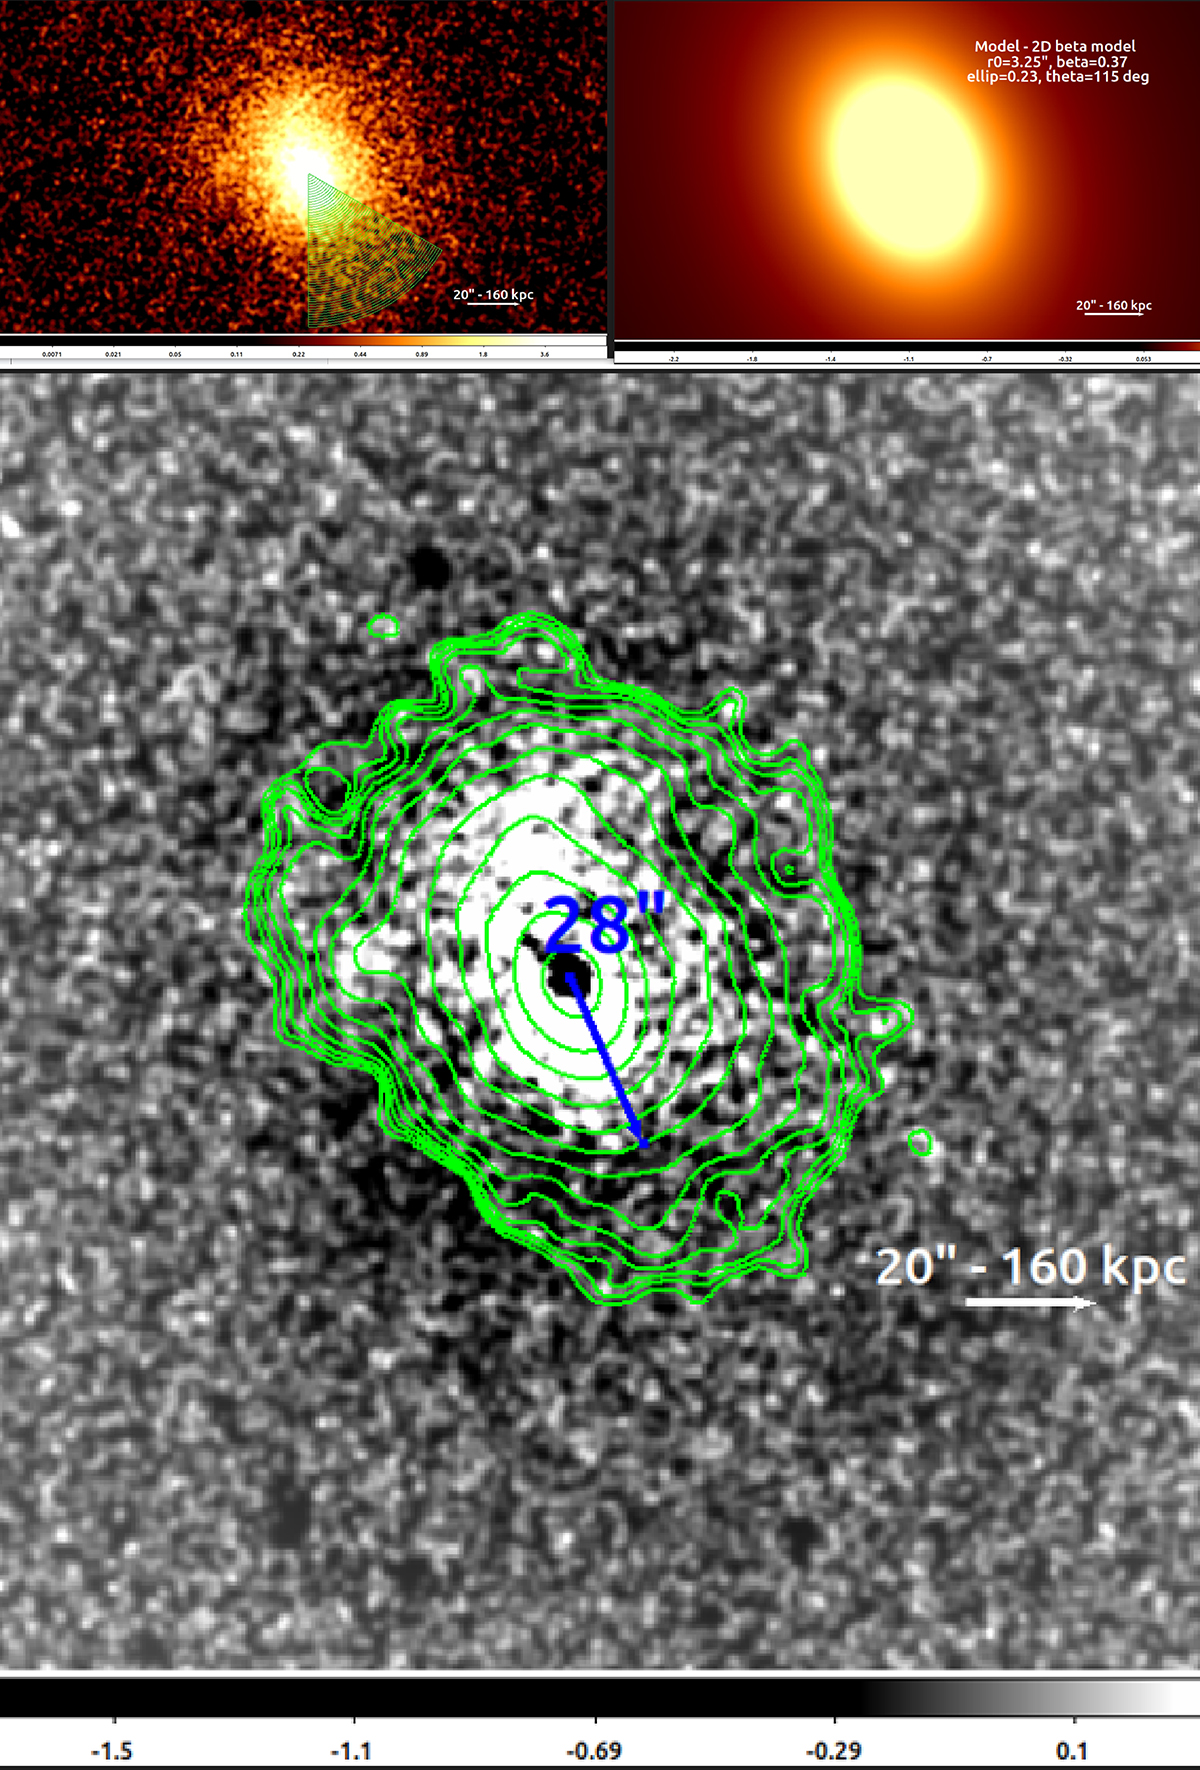
Residual X-ray emission of SPT0615. Top left: Chandra image of SPT0615 used for the 2D fitting with a beta model. We also indicate the angular region we used to measure the surface brightness profile in Fig. 10. Top right: beta model and best-fit parameters. Bottom: residual from the fit. The region near the hot core is very clearly detached from the other excess over the beta-model fit region. A larger excess region over a significant part of the central cluster elongation is visible as well. It extends 280 kpc to each side from the center. North is up, and east is left.
Current usage metrics show cumulative count of Article Views (full-text article views including HTML views, PDF and ePub downloads, according to the available data) and Abstracts Views on Vision4Press platform.
Data correspond to usage on the plateform after 2015. The current usage metrics is available 48-96 hours after online publication and is updated daily on week days.
Initial download of the metrics may take a while.