Open Access
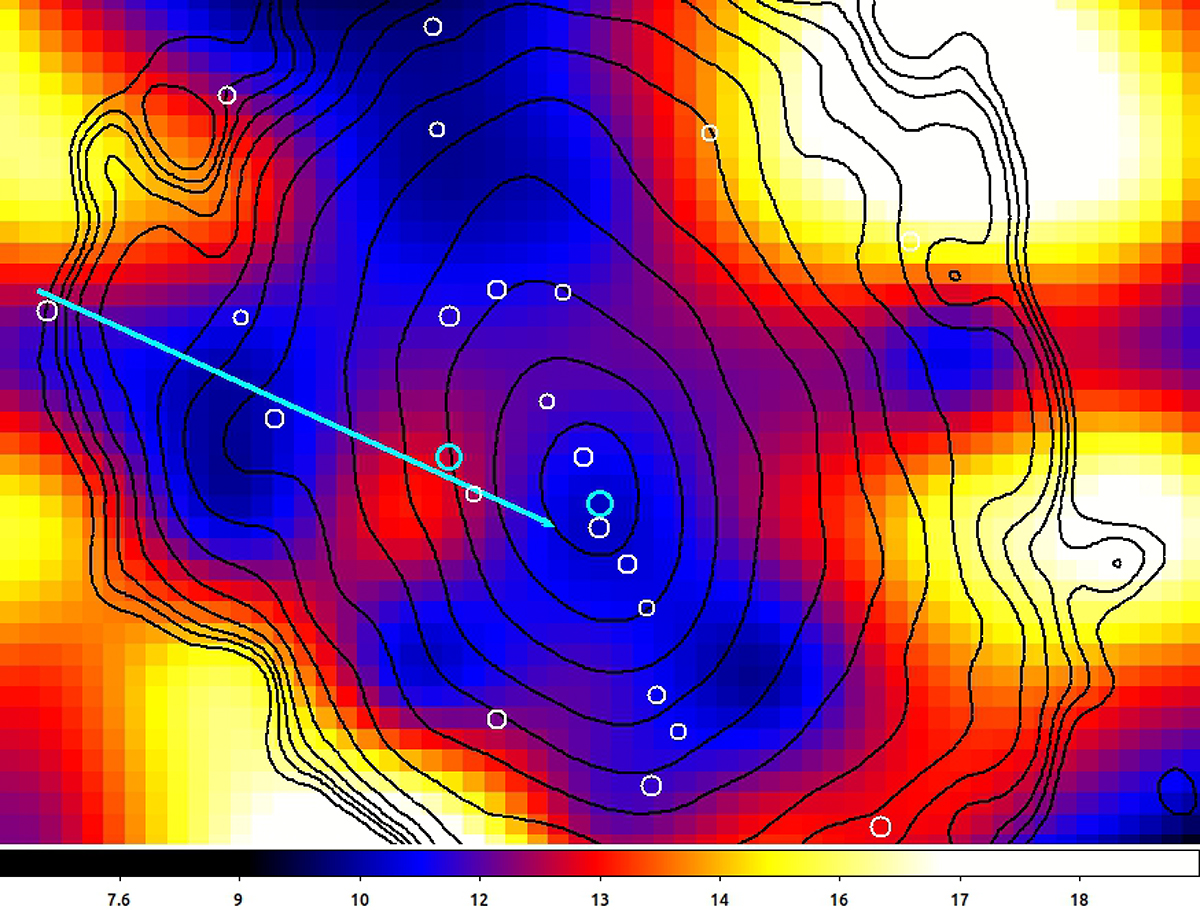
Fig. 8.
Download original image
Zoom-in of the temperature map shown in Fig. 7, with X-ray contours in black and a possible projected merging configuration. The position of the BCG and the large ELG of the hypothesized incoming cluster are shown in cyan (bold) as well as the other confirmed member galaxies in the region. North is up. East is left.
Current usage metrics show cumulative count of Article Views (full-text article views including HTML views, PDF and ePub downloads, according to the available data) and Abstracts Views on Vision4Press platform.
Data correspond to usage on the plateform after 2015. The current usage metrics is available 48-96 hours after online publication and is updated daily on week days.
Initial download of the metrics may take a while.