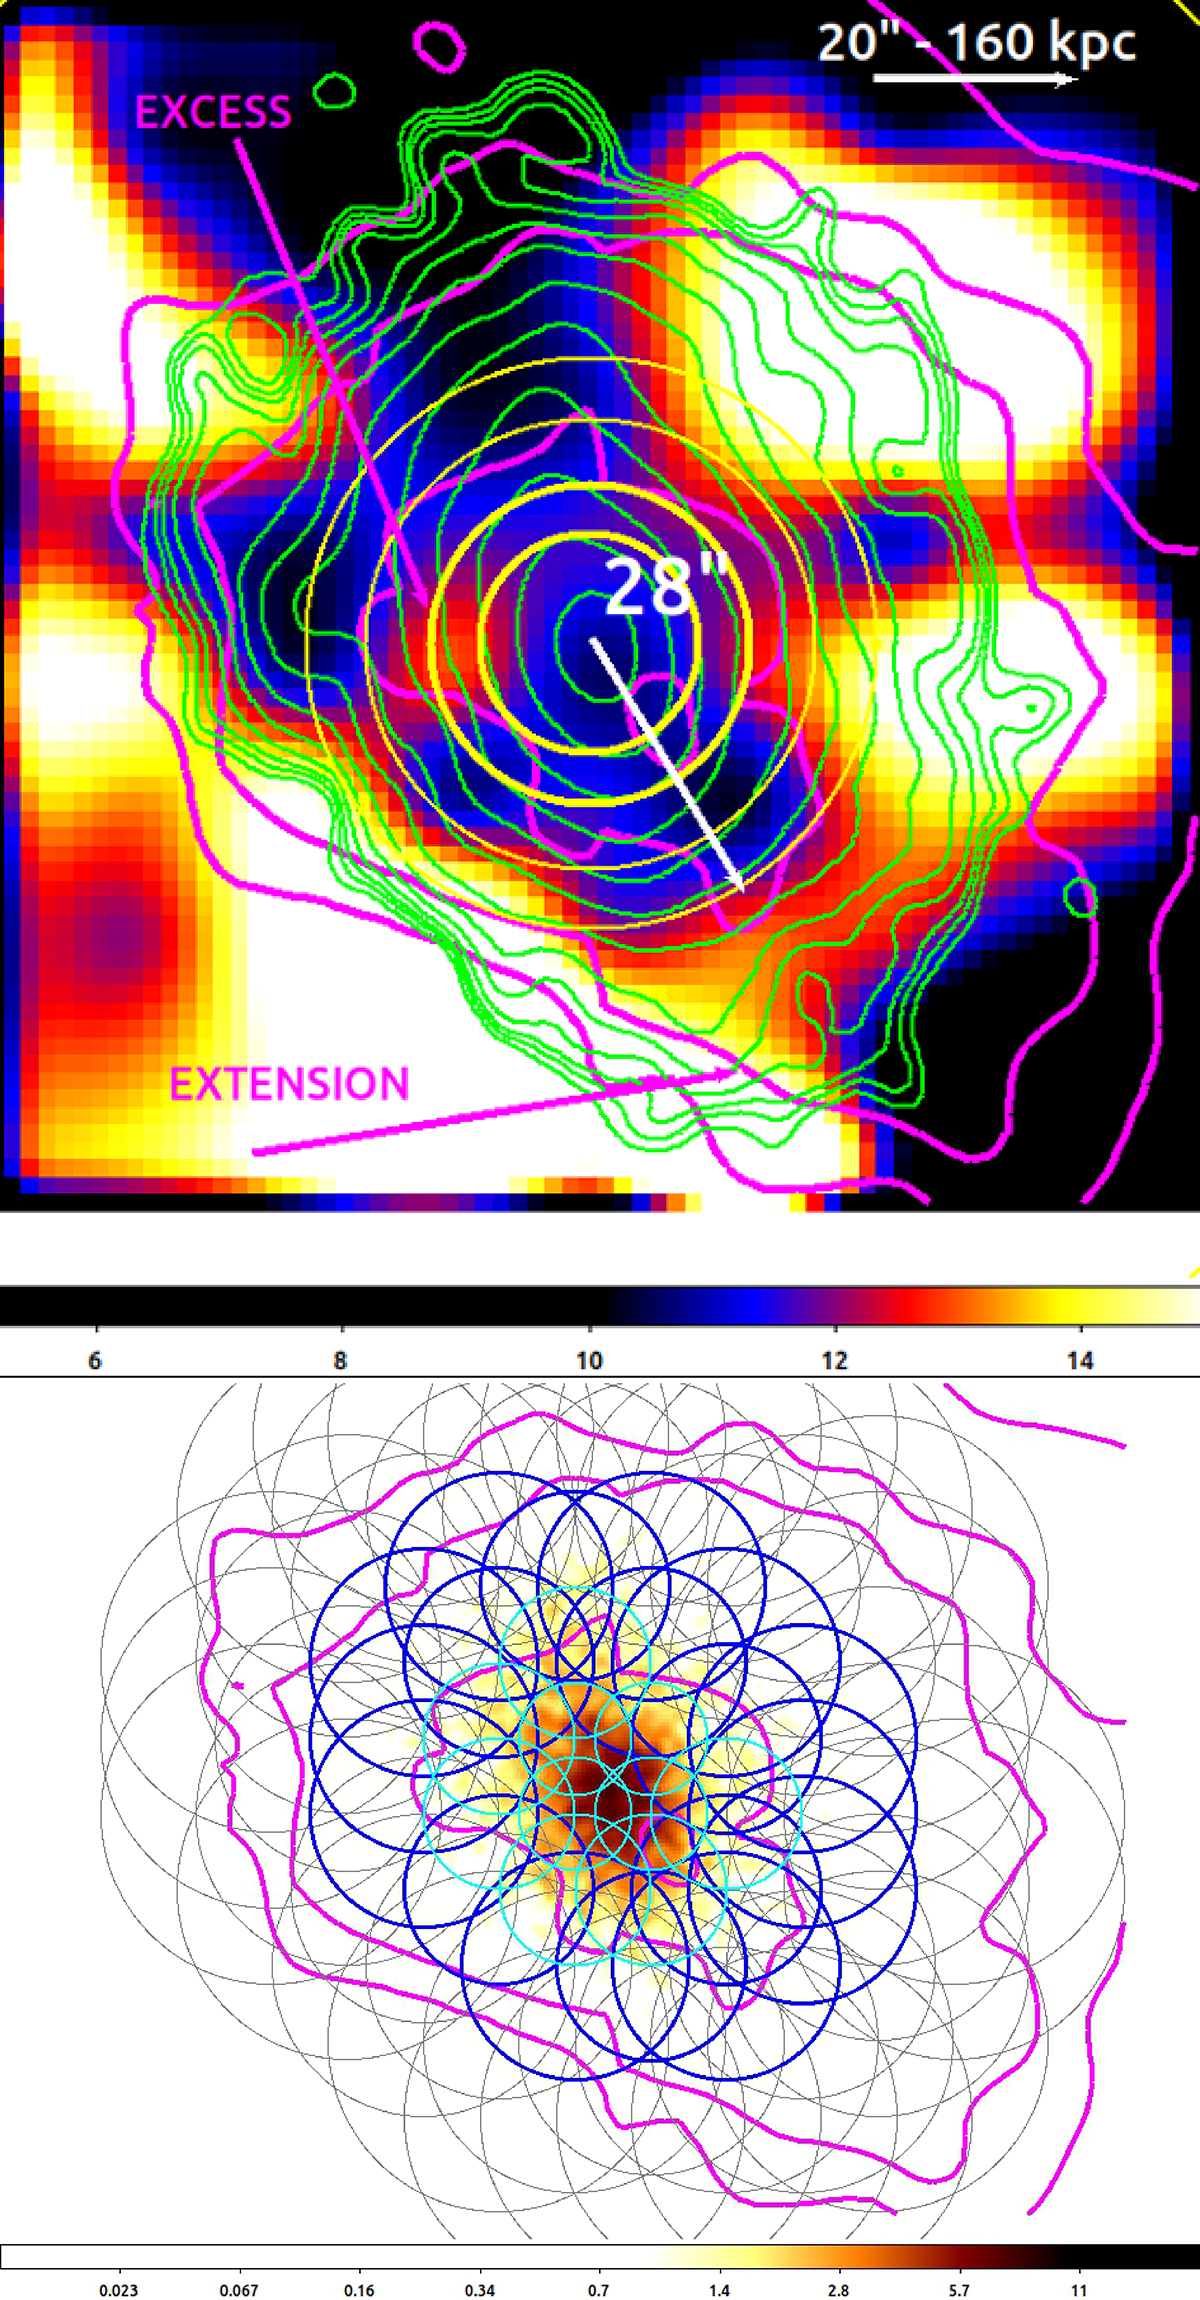
Fig. 7.
Download original image
Adaptive-smoothing temperature map of SPT0615. Top: adaptively smoothed image of the projected intracluster gas temperature in keV. The surface brightness contours in green are the same as in the bottom panel of Fig. 4. The concentric annuli used for radial spectral extraction in Fig. 6 are shown in yellow, and the annulus corresponding to the temperature spike is plotted in bold. The magenta contours show the fractional error of the temperatures corresponding to 10%, 15%, 25%, and 35% from the inside outward. In white we indicated the position of a candidate cold front from a previous merger (Sect. 3.3). Bottom: smoothing overlap of the characteristic size of regions with radii below 25″ prior to Kriging interpolation. The magenta contours correspond to the same fractional temperature errors as plotted in the top panel. North is up. East is left.
Current usage metrics show cumulative count of Article Views (full-text article views including HTML views, PDF and ePub downloads, according to the available data) and Abstracts Views on Vision4Press platform.
Data correspond to usage on the plateform after 2015. The current usage metrics is available 48-96 hours after online publication and is updated daily on week days.
Initial download of the metrics may take a while.