Fig. 6.
Download original image
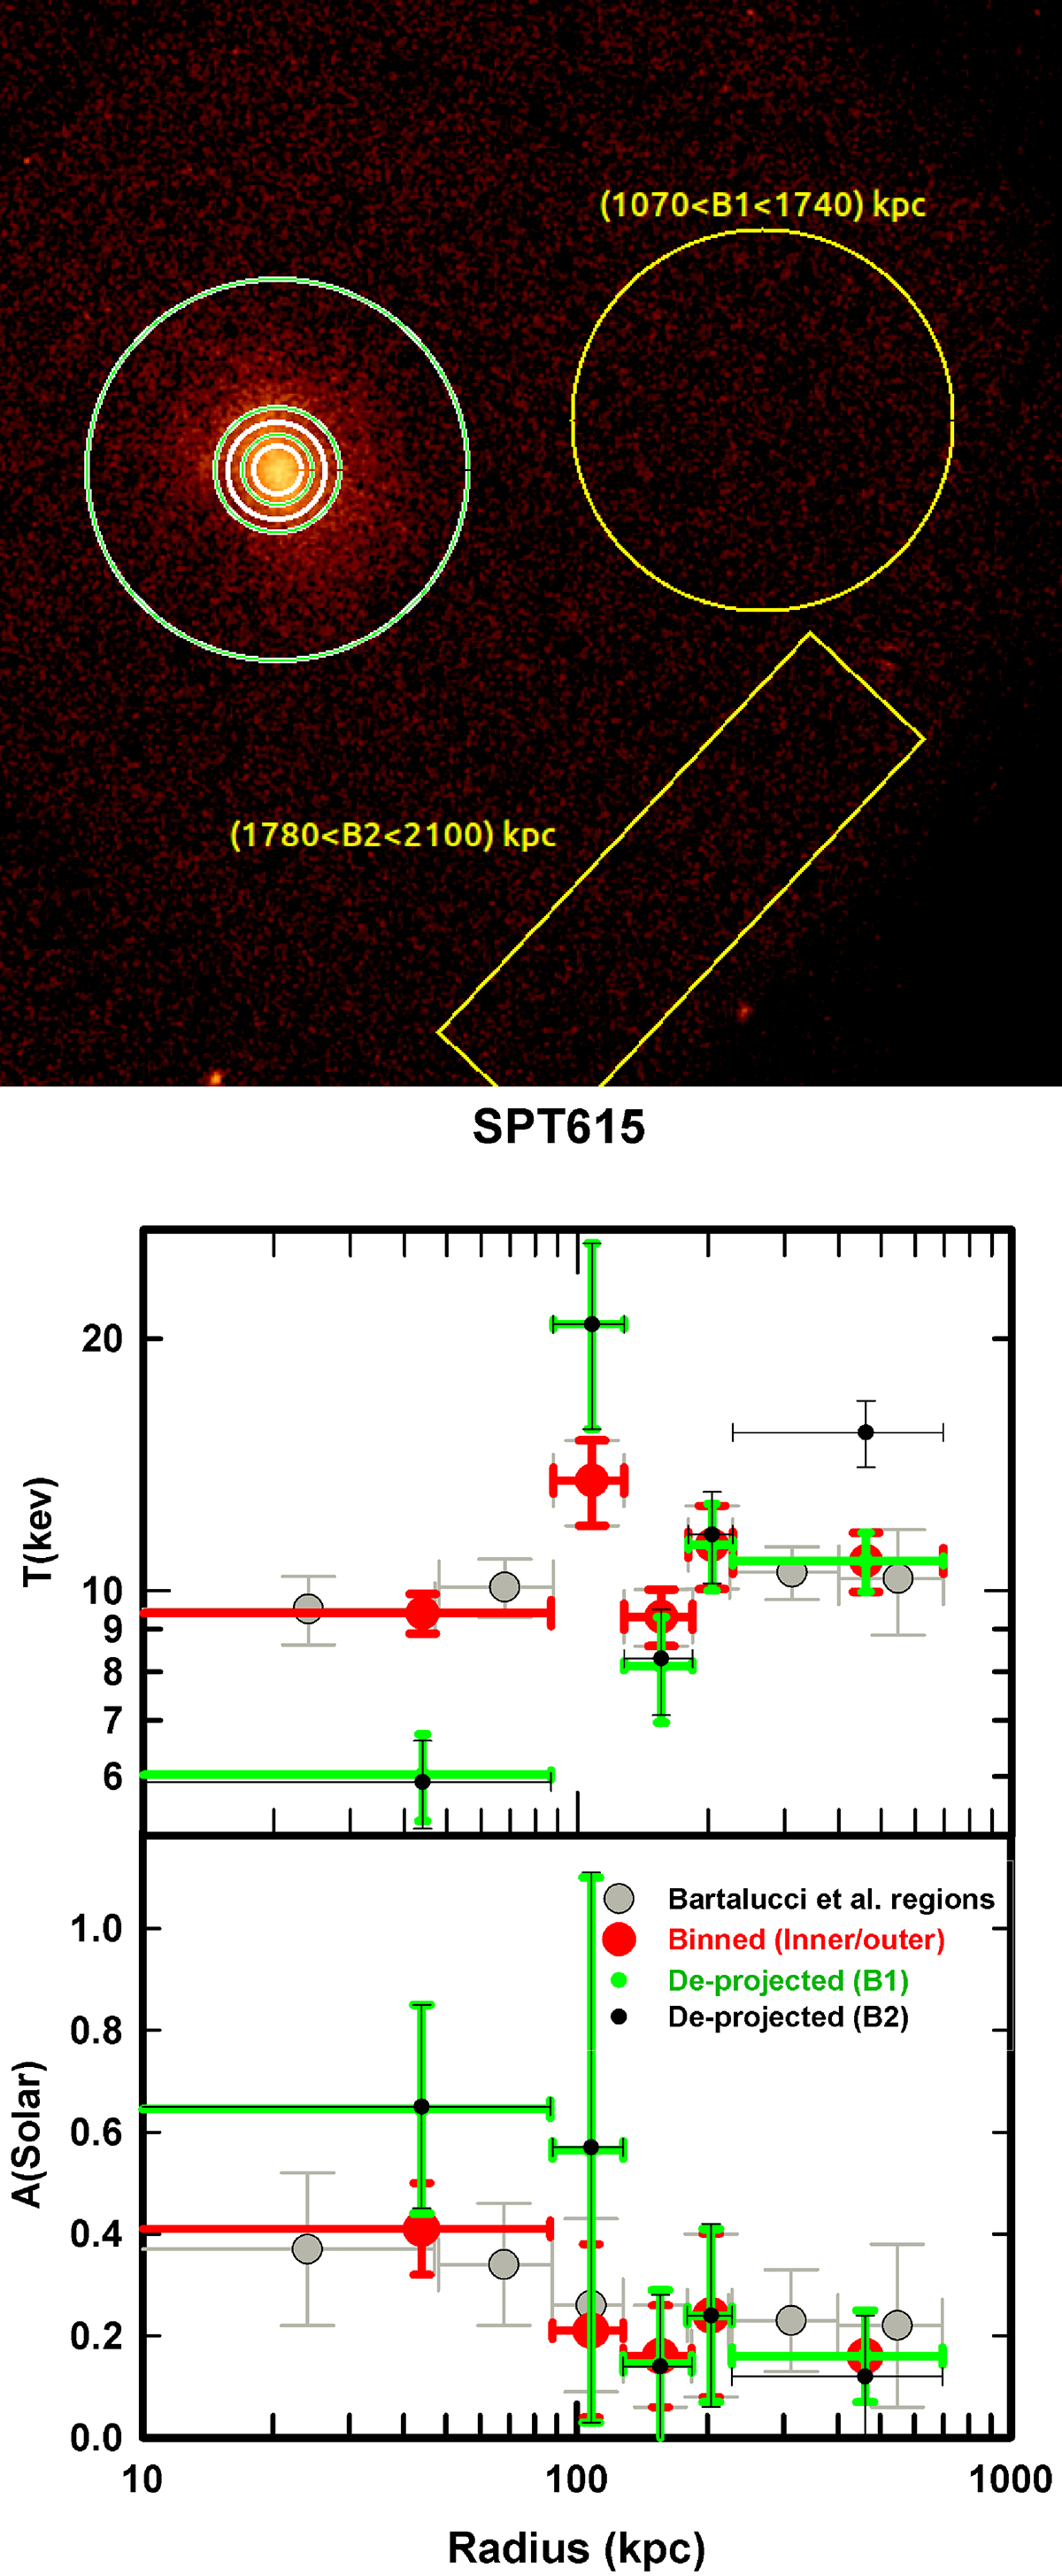
Intracluster gas temperature and radial distributions of the metal abundance. Top: Chandra ACIS-S3 image of SPT0615 with the concentric annuli (white) regions used in Bartalucci et al. (2017) and reanalyzed in this work. We also show two different background regions (B1 and B2) in this analysis (yellow) to illustrate the possible contamination of the cluster emission at different distances from the center. Bottom: projected radial profile of the temperatures and metal abundances corresponding to the concentric annuli shown in the top panel are shown in gray. We also show the same distribution where we join the inner two bins and the outer two bins in red. In green and black, we show the deprojected profiles using the B1 and B2 background regions, respectively. North is up. East is left.
Current usage metrics show cumulative count of Article Views (full-text article views including HTML views, PDF and ePub downloads, according to the available data) and Abstracts Views on Vision4Press platform.
Data correspond to usage on the plateform after 2015. The current usage metrics is available 48-96 hours after online publication and is updated daily on week days.
Initial download of the metrics may take a while.