Fig. 5.
Download original image
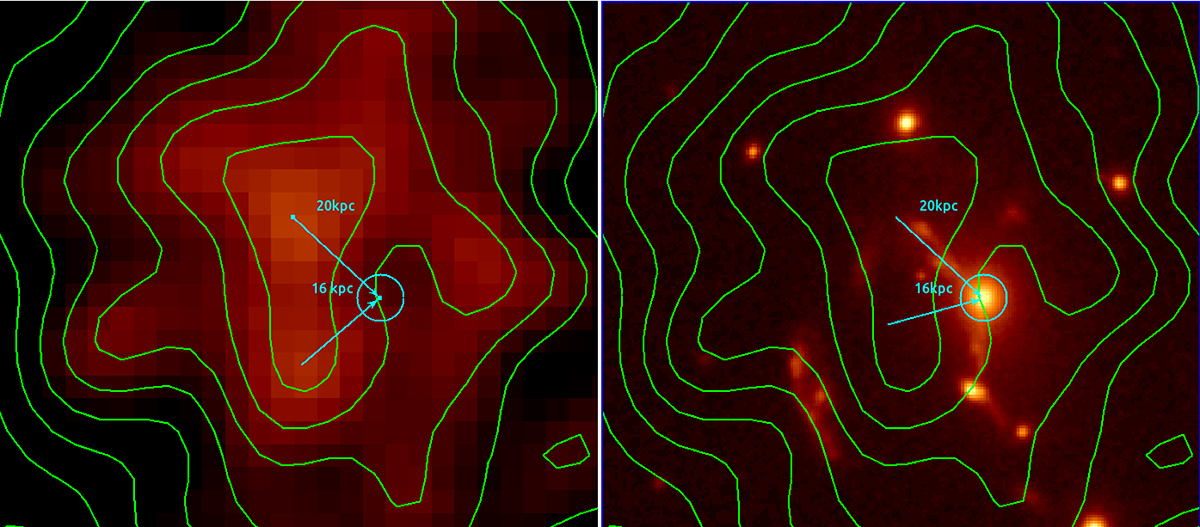
Very central region of SPT0615. Left: Chandra X-ray image and isocontours in the very core of SPT0615. The position of the BCG is shown by a circle, and the approximate distance from each of the bright X-ray cores is plotted as well. Right: HST image of the same region. The X-ray contours are overlaid. None of the X-ray brightest central regions coincide with the BCG or any other galaxy.
Current usage metrics show cumulative count of Article Views (full-text article views including HTML views, PDF and ePub downloads, according to the available data) and Abstracts Views on Vision4Press platform.
Data correspond to usage on the plateform after 2015. The current usage metrics is available 48-96 hours after online publication and is updated daily on week days.
Initial download of the metrics may take a while.