Fig. 4.
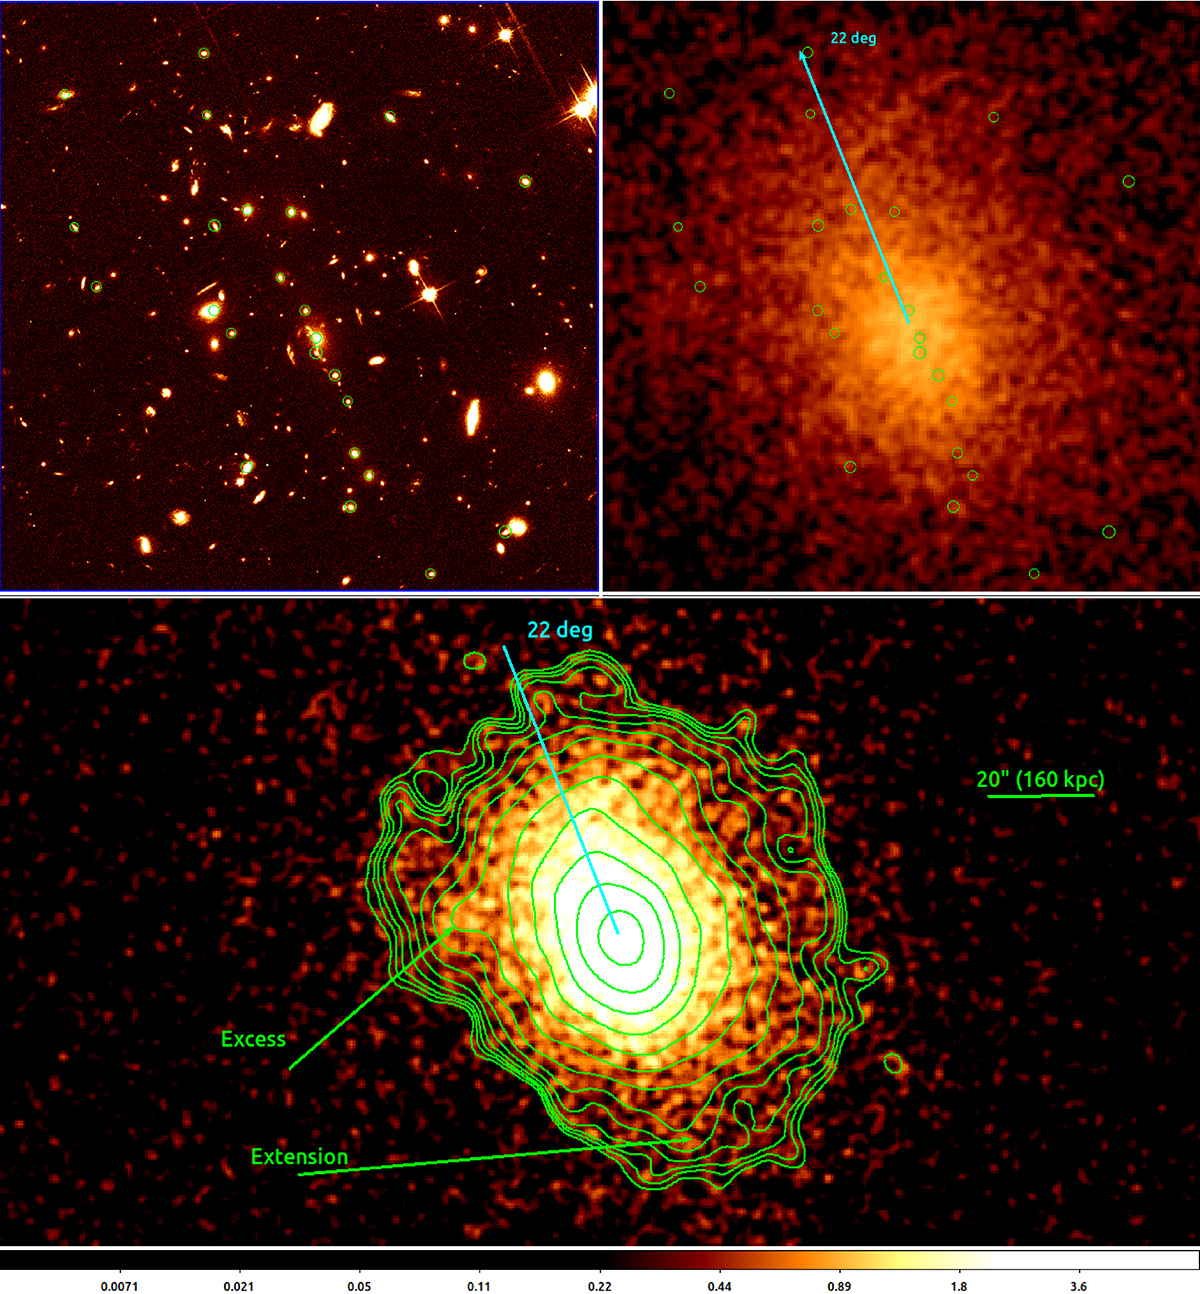
Download original image
Optical and X-ray images of SPT0615. Top left: HST/ACS image in the F814W filter of SPT0615. Spectroscopically confirmed member galaxies are indicated by green circles. Top right: Chandra image of the same region. The alignment seen in the galaxy distribution coincides with the major axis of the surface brightness distribution in X-rays at the inclination of ∼22° shown in the bottom figure. Bottom: X-ray isocontours of SPT0615, which show a similar elongation as the galaxy distribution and critical lensing curves (Fig. 6 of Paterno-Mahler et al. 2018). Excess X-ray emission can be seen clearly east and south, and it is marked by green arrows. North is up. East is left.
Current usage metrics show cumulative count of Article Views (full-text article views including HTML views, PDF and ePub downloads, according to the available data) and Abstracts Views on Vision4Press platform.
Data correspond to usage on the plateform after 2015. The current usage metrics is available 48-96 hours after online publication and is updated daily on week days.
Initial download of the metrics may take a while.