Fig. 2.
Download original image
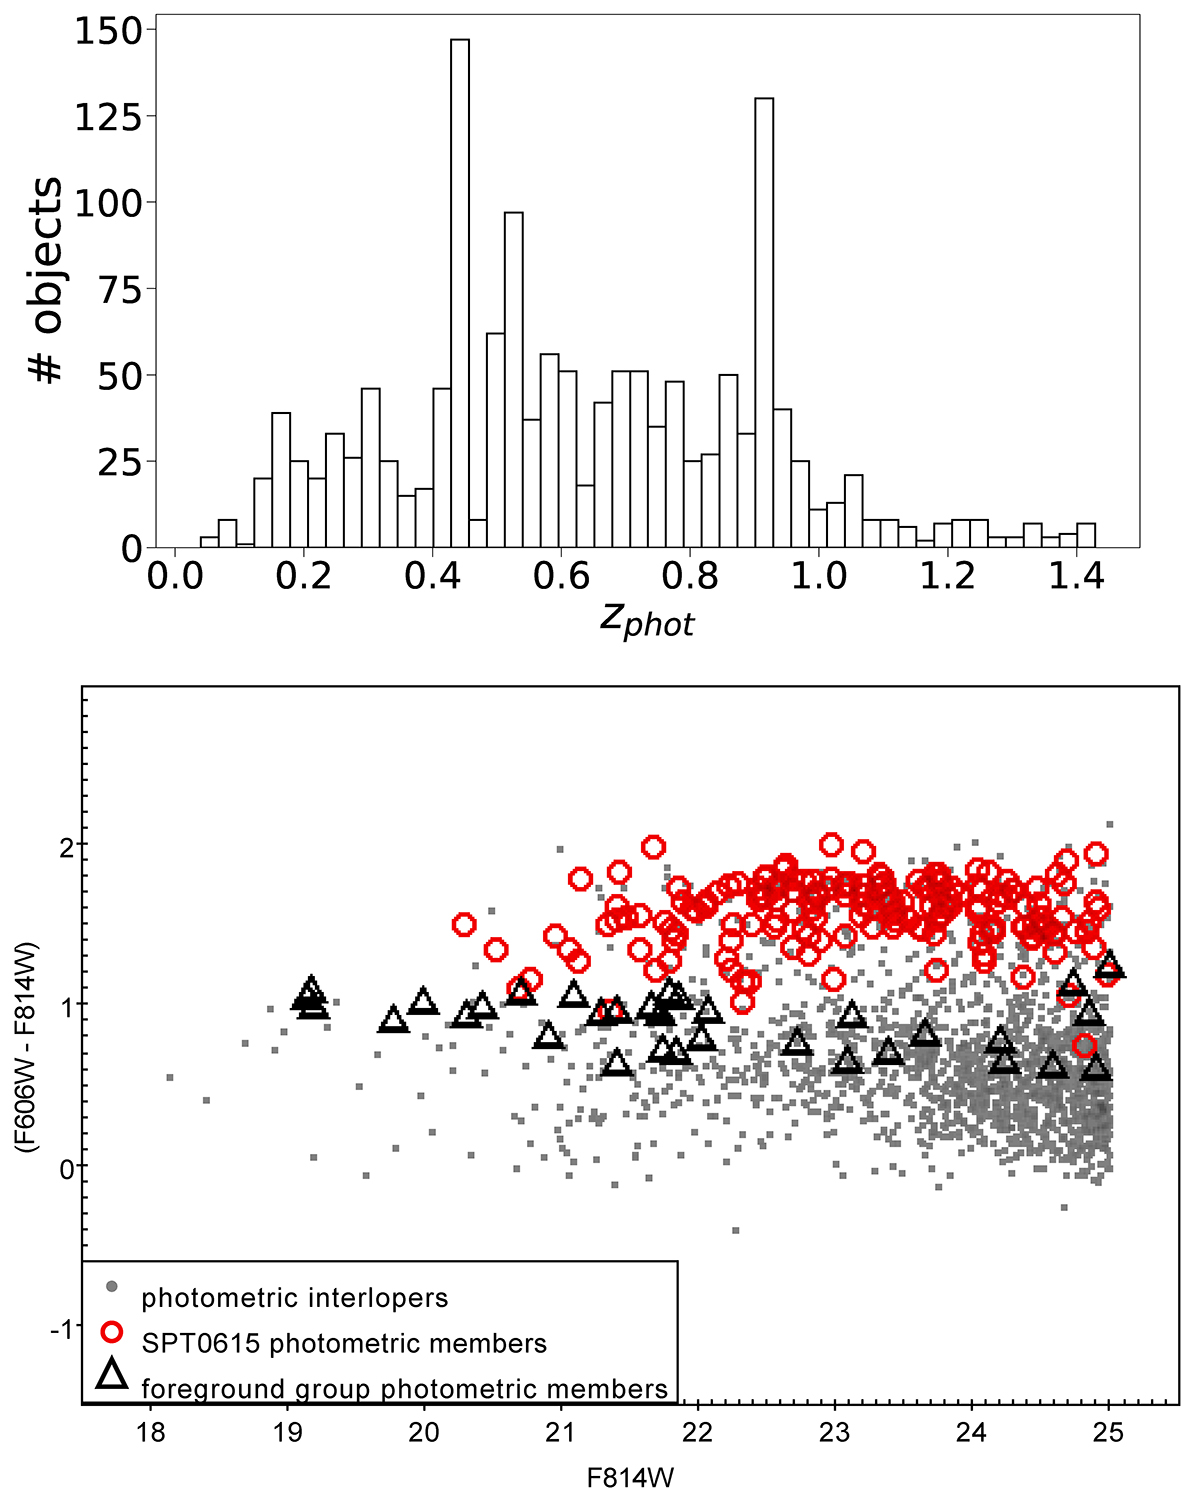
Photometric cluster membership. Top: photometric redshift distribution of the galaxies in the region of SPT0615. Bottom: color-magnitude diagram with the members of SPT0615 at z = 0.97 in red and those of the possible foreground structure at z ∼ 0.44 in black. Gray points correspond to interlopers that do not belong to any of the two structures.
Current usage metrics show cumulative count of Article Views (full-text article views including HTML views, PDF and ePub downloads, according to the available data) and Abstracts Views on Vision4Press platform.
Data correspond to usage on the plateform after 2015. The current usage metrics is available 48-96 hours after online publication and is updated daily on week days.
Initial download of the metrics may take a while.