Fig. 11.
Download original image
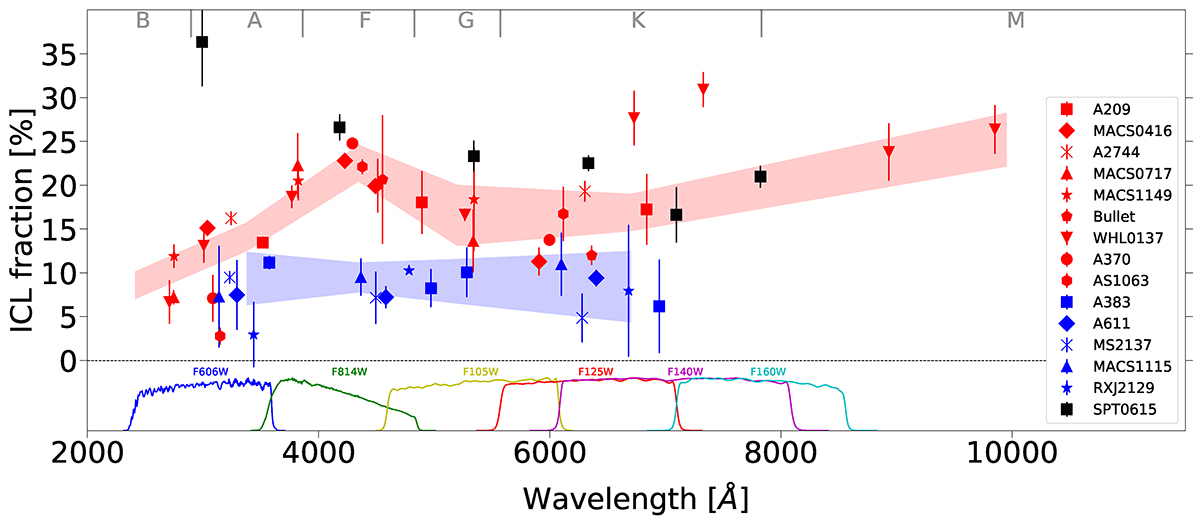
ICL fractions of SPT0615 (black squares) as derived by CICLE, compared with a subsample of relaxed (blue) and merging (red) clusters at intermediate redshift. The plot is divided into six regions according to the emission peaks of the different stellar types, indicated at the top with gray letters. The red and blue regions indicate the error-weighted average of the measurements within each stellar region for the merging and relaxed systems, respectively. At the bottom, we plot the transmission curves of the filters we used for the analysis of SPT0615. All points are in the rest frame.
Current usage metrics show cumulative count of Article Views (full-text article views including HTML views, PDF and ePub downloads, according to the available data) and Abstracts Views on Vision4Press platform.
Data correspond to usage on the plateform after 2015. The current usage metrics is available 48-96 hours after online publication and is updated daily on week days.
Initial download of the metrics may take a while.