Fig. 10.
Download original image
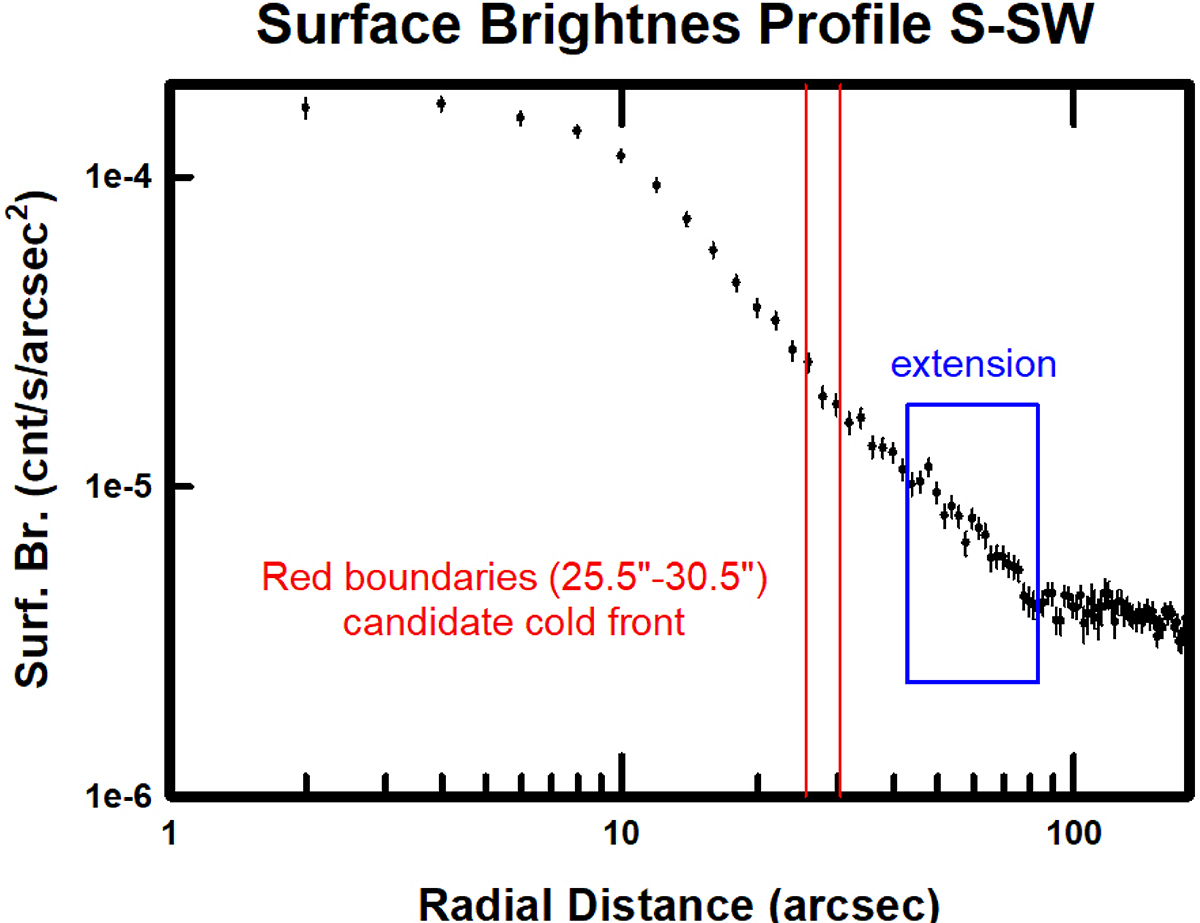
Surface brightness profile throughout the angular region shown in the left panel of Fig. 9, in the direction of the southern hot shell seen in the temperature map in the top panel of Fig. 7. A marginal sudden surface brightness decrease is seen about 28″ from the cluster center (framed by the two vertical red lines). This coincides with the inner hot shell. The extended emission past this point is also apparent.
Current usage metrics show cumulative count of Article Views (full-text article views including HTML views, PDF and ePub downloads, according to the available data) and Abstracts Views on Vision4Press platform.
Data correspond to usage on the plateform after 2015. The current usage metrics is available 48-96 hours after online publication and is updated daily on week days.
Initial download of the metrics may take a while.