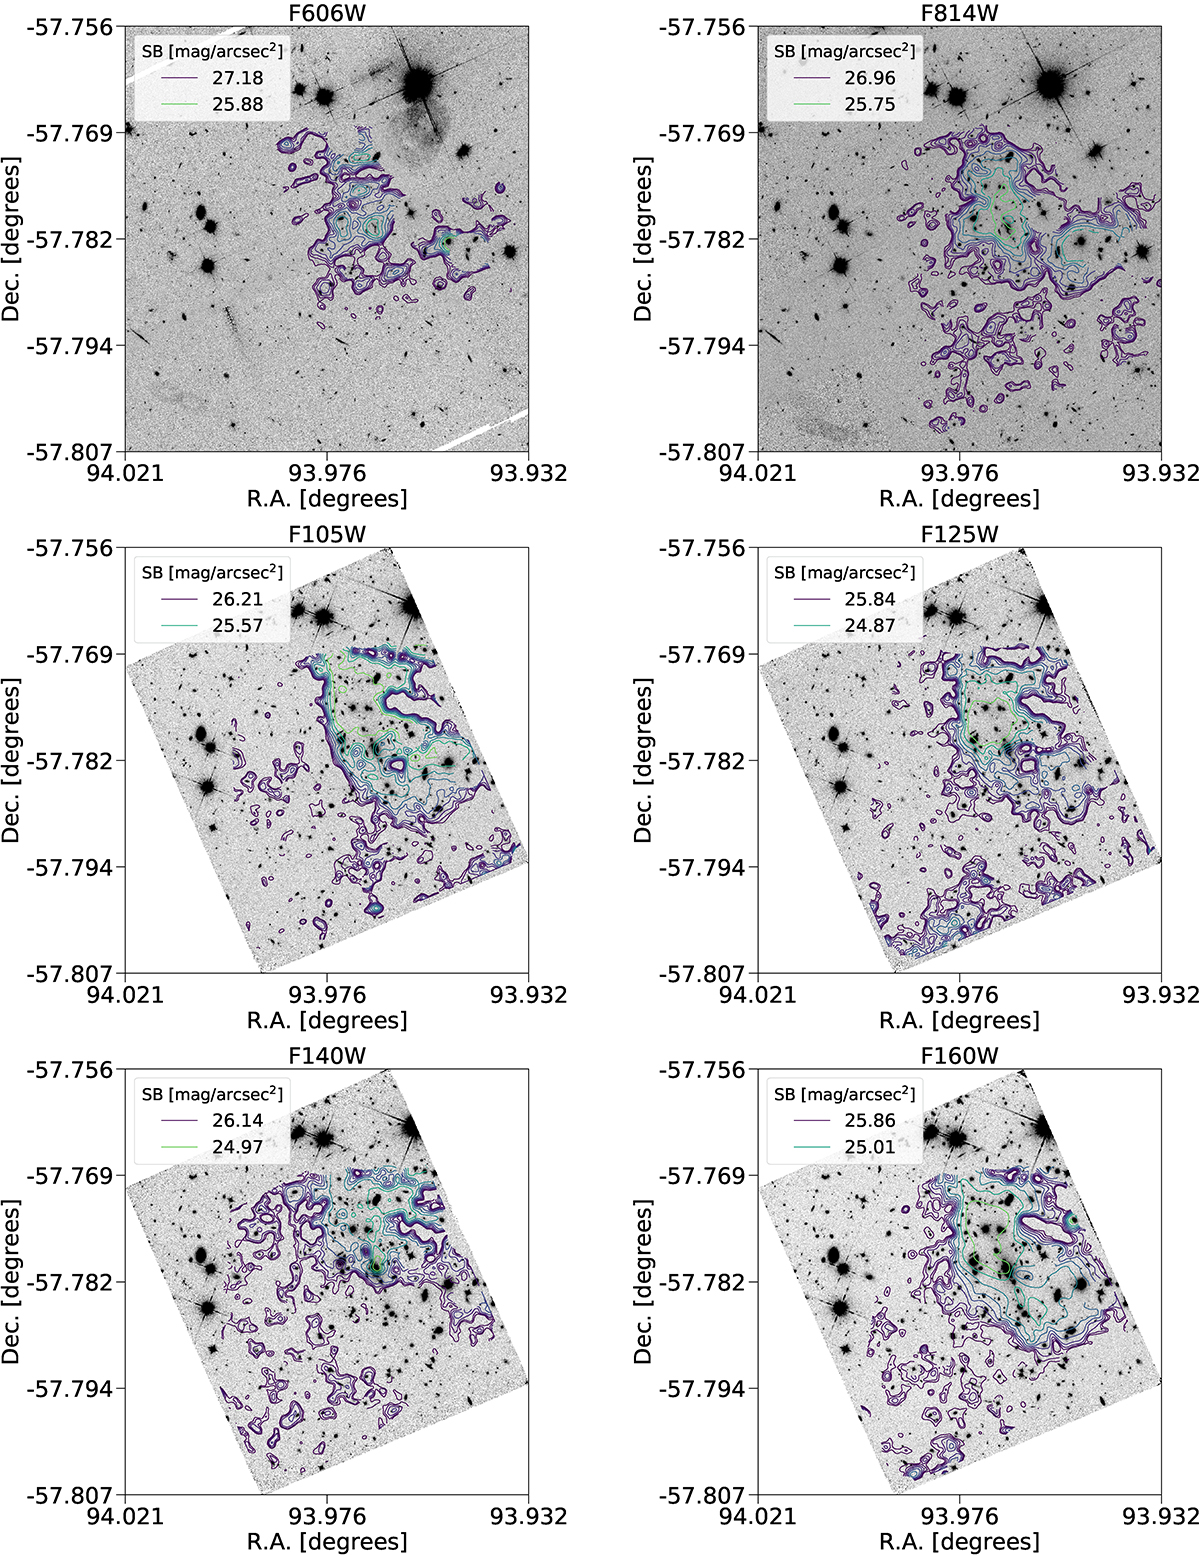
Fig. 1.
Download original image
ICL isocontours superimposed on the original images in the six HST ACS and WFC3 filters. For each band, we plot ten logarithmically spaced isocontours. The lowest level is calculated from the detection limit of the ICL (where it converges with the background level), and the highest level corresponds to its maximum value. We report the surface brightness limits for the lowest and highest isocontours inside each panel. Two main ICL clumps appear in all bands. They are more clearly separated in the bluer filters.
Current usage metrics show cumulative count of Article Views (full-text article views including HTML views, PDF and ePub downloads, according to the available data) and Abstracts Views on Vision4Press platform.
Data correspond to usage on the plateform after 2015. The current usage metrics is available 48-96 hours after online publication and is updated daily on week days.
Initial download of the metrics may take a while.