Fig. D.1.
Download original image
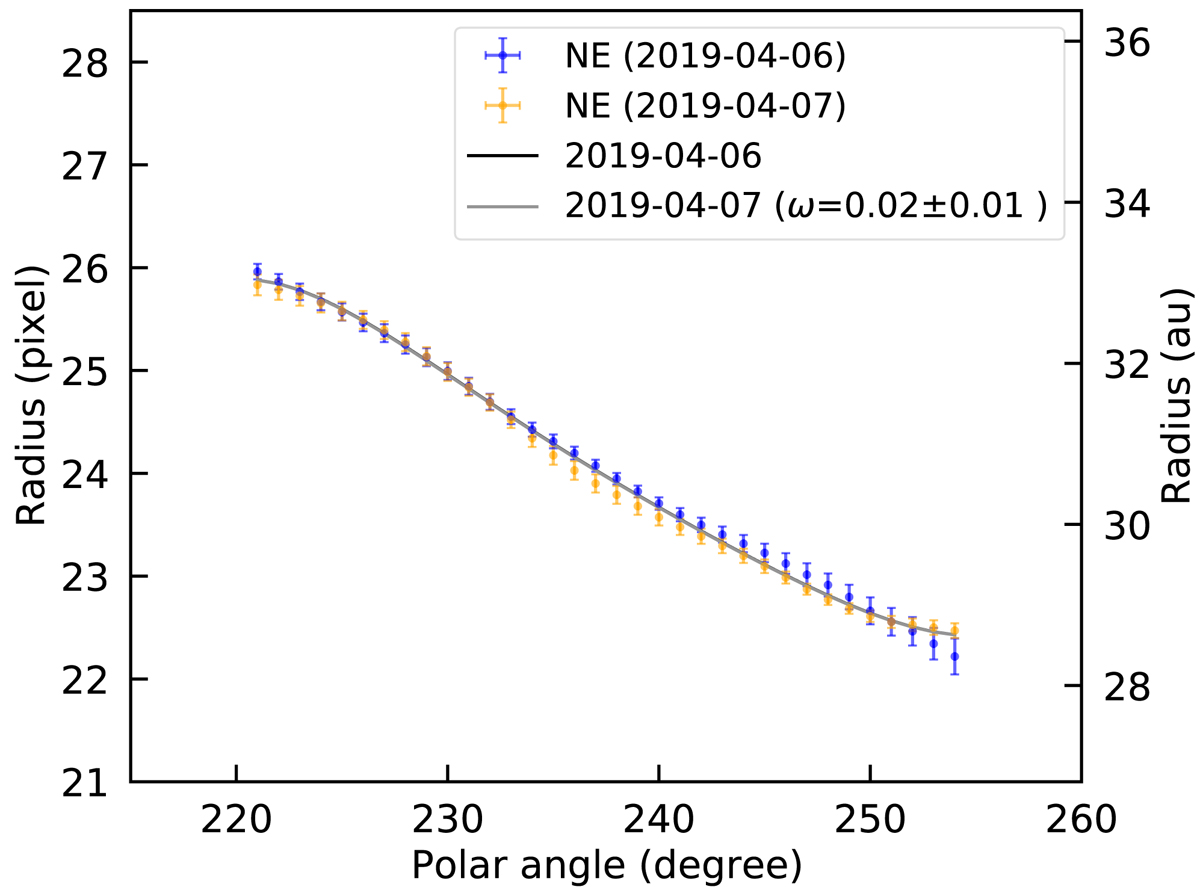
Peak locations of spiral arm S1 in polar coordinates after the correction for the viewing geometry. Solid curves represent the best-fit model spiral for the peak locations (dot) between two epoch observations in 2019, assuming the companion-driven scenario. Two curves (black and gray) are overlapped. The derived angular velocities of spiral pattern motion are ![]() yr−1, which indicates the uncertainty caused by PSF subtraction instead of the real motion.
yr−1, which indicates the uncertainty caused by PSF subtraction instead of the real motion.
Current usage metrics show cumulative count of Article Views (full-text article views including HTML views, PDF and ePub downloads, according to the available data) and Abstracts Views on Vision4Press platform.
Data correspond to usage on the plateform after 2015. The current usage metrics is available 48-96 hours after online publication and is updated daily on week days.
Initial download of the metrics may take a while.