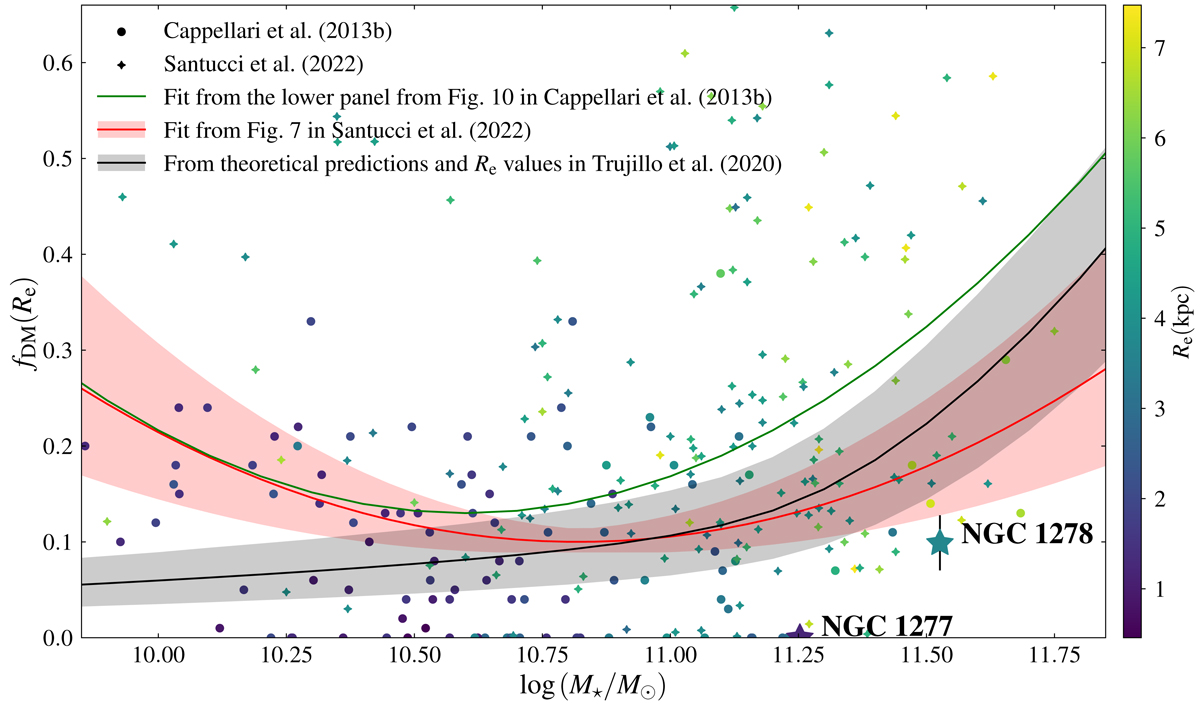
Fig. 21.
Download original image
Dark matter fraction within the effective radius, fDM(Re), as a function of the stellar mass for NGC 1277 and NGC 1278 (star symbols). The error bars represent one sigma confidence intervals (that corresponding to NGC 1277 is smaller than the symbol size). Circles correspond to the 103 ATLAS3D galaxies with good fits in Cappellari et al. (2013a) and the diamond symbols correspond to the data for a sample of 161 passive galaxies from the SAMI Galaxy Survey from Santucci et al. (2022). The colour coding of the symbols indicates the effective radius of the galaxies as shown by the side-bar. The ATLAS3D data points were derived by merging the galaxy distances from Cappellari et al. (2011), the effective radii and luminosities from Cappellari et al. (2013a), and the fDM(Re) and Υ⋆ values from Cappellari et al. (2013b). The effective radii for the SAMI galaxies were kindly provided by G. Santucci. The green line indicates the M⋆ − fDM(Re) relation derived from JAM models with a fixed cosmologically motivated NFW dark matter halo from Cappellari et al. (2013a). The red line and confidence band correspond to the fit represented in Fig. 7 from Santucci et al. (2022). The black line shows a prediction of the M⋆ − fDM(Re) relation made by combining the dark matter haloes derived from the SHMR from Girelli et al. (2020) and the dark matter halo parametrisation from Child et al. (2018) with the Re values derived from a linear fit (Eq. (20)) to the size measurements for galaxies with a morphological type T ≤ −1 in Trujillo et al. (2020). The latter relation was calculated assuming a de Vaucouleurs (1948) profile for the stellar component and it is complemented by a one-sigma uncertainty band calculated using a Montecarlo simulation. For the Trujillo et al. (2020) and the Santucci et al. (2022) data and the Girelli et al. (2020) SHMR, the stellar masses were corrected by a factor 0.23 dex to convert the assumed Chabrier (2003) IMF into a Salpeter (1955) one (see Eq. (3) in Sect. 3.2).
Current usage metrics show cumulative count of Article Views (full-text article views including HTML views, PDF and ePub downloads, according to the available data) and Abstracts Views on Vision4Press platform.
Data correspond to usage on the plateform after 2015. The current usage metrics is available 48-96 hours after online publication and is updated daily on week days.
Initial download of the metrics may take a while.