Fig. 10.
Download original image
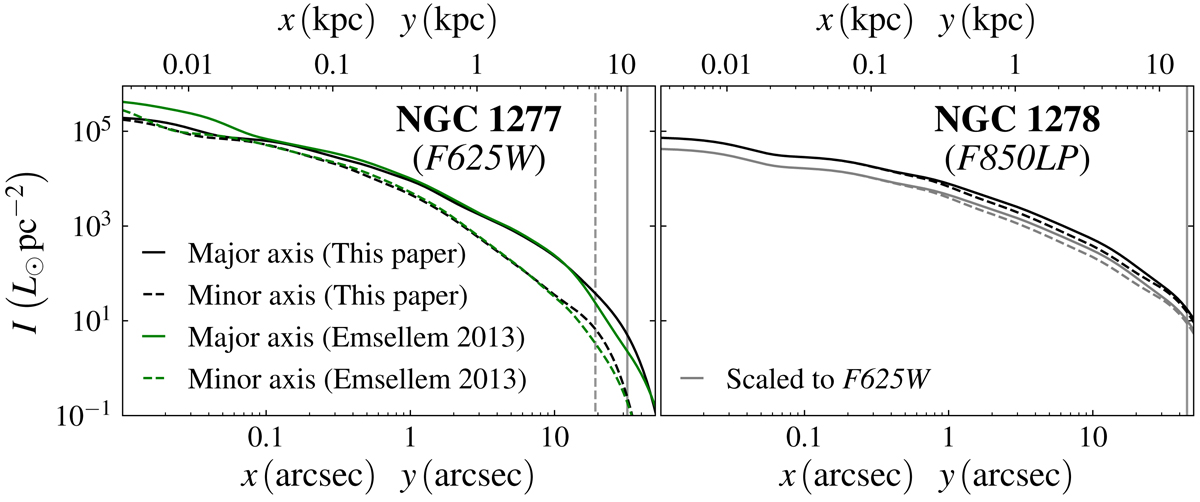
Major- (continuous line and coordinate x) and minor-axis (dashed line and coordinate y) surface brightness profiles of NGC 1277 (left panel; in F625W) and NGC 1278 (right panel; in F850LP). Black lines come from our MGE fit and green ones come from Emsellem (2013) after a correction for extinction. The vertical grey lines indicate the maximum extent of the fitting area along the major (continuous) and the minor axis (dashed). For NGC 1278 the minor and major axis surface brightness profiles are nearly undistinguishable. The grey curves in the right panel correspond to the F625W surface brightness profiles calculated under the assumption that r − z = 0.74 (see text).
Current usage metrics show cumulative count of Article Views (full-text article views including HTML views, PDF and ePub downloads, according to the available data) and Abstracts Views on Vision4Press platform.
Data correspond to usage on the plateform after 2015. The current usage metrics is available 48-96 hours after online publication and is updated daily on week days.
Initial download of the metrics may take a while.