Fig. A.1.
Download original image
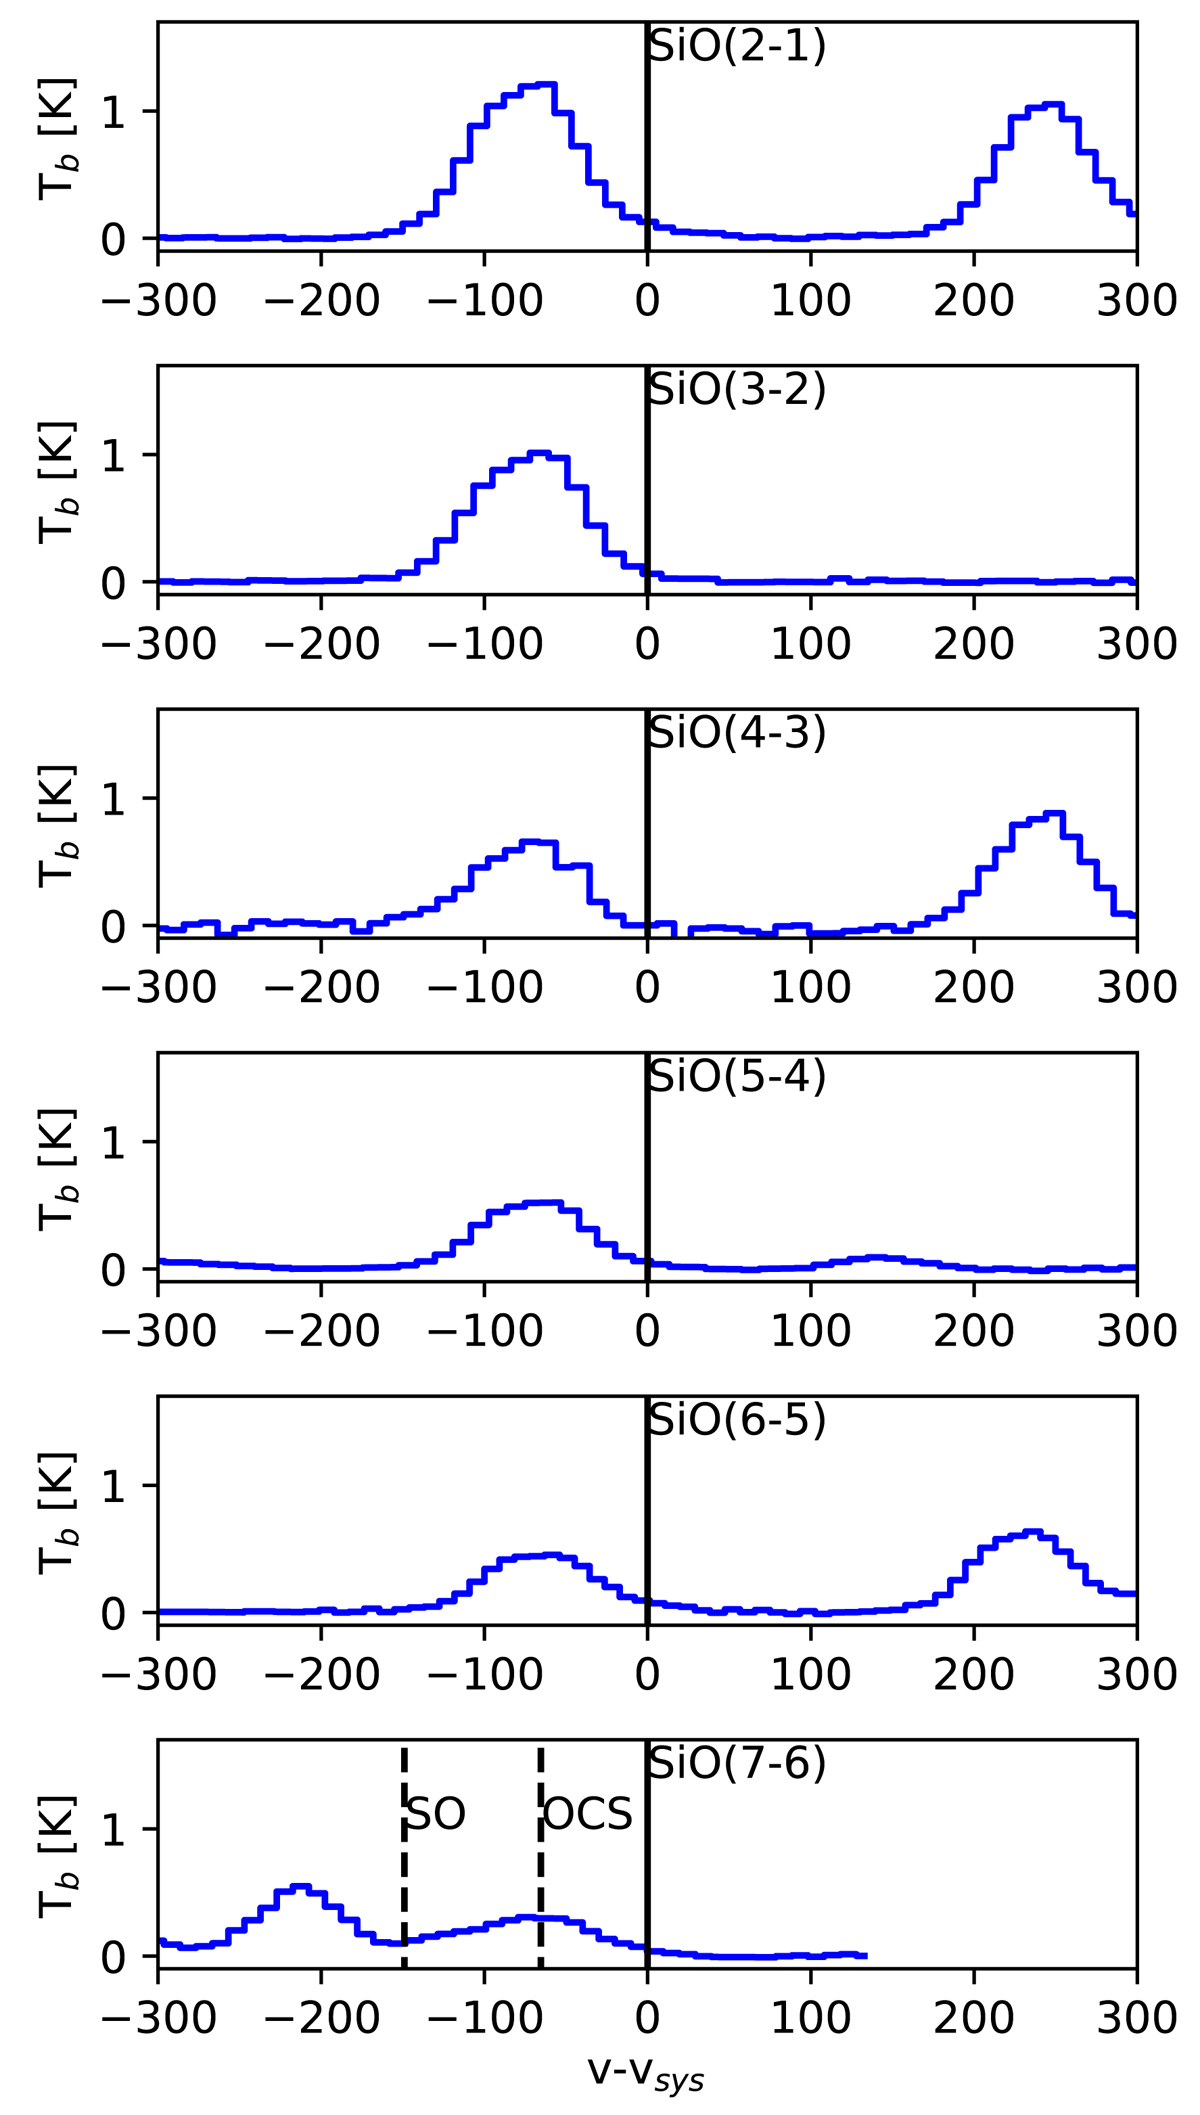
Spectra extracted from GMC 6, for all SiO transitions. used in this work. The solid vertical line marks the rest frequency of each transition, and the dashed vertical line(s) the adjacent or blending line.
Current usage metrics show cumulative count of Article Views (full-text article views including HTML views, PDF and ePub downloads, according to the available data) and Abstracts Views on Vision4Press platform.
Data correspond to usage on the plateform after 2015. The current usage metrics is available 48-96 hours after online publication and is updated daily on week days.
Initial download of the metrics may take a while.