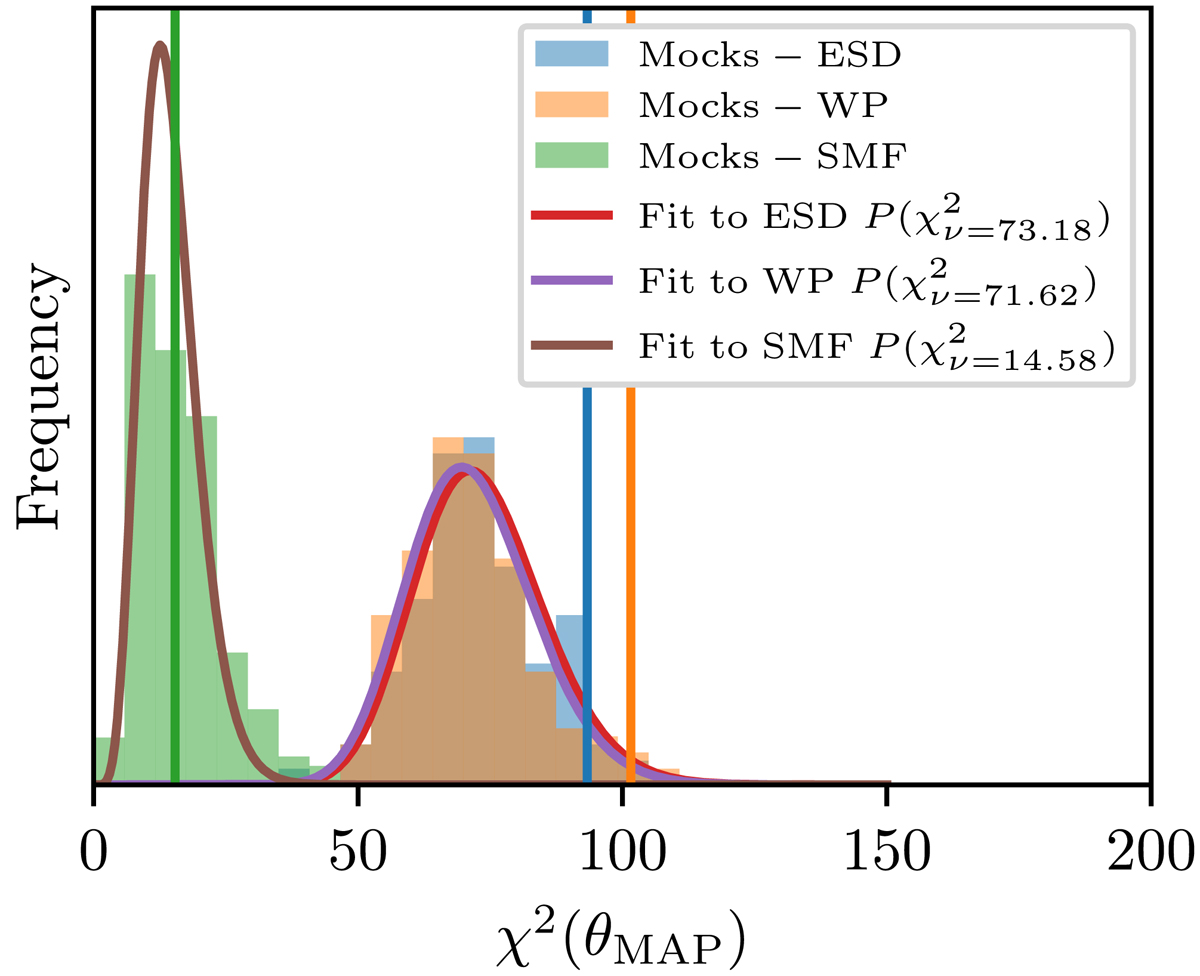
Fig. C.2.
Download original image
Same as Fig. C.1, but for the three different observables in our analysis. The fits to the distributions are used to determine the number of degrees of freedom for each observable, which are in turn are used to determine the reduced χ2 values for each of them. Note that the χ2 distributions are not a result of maximising the posterior for that section of the mocks. The vertical lines show the χ2 values from the real data, matching in colours with the histograms.
Current usage metrics show cumulative count of Article Views (full-text article views including HTML views, PDF and ePub downloads, according to the available data) and Abstracts Views on Vision4Press platform.
Data correspond to usage on the plateform after 2015. The current usage metrics is available 48-96 hours after online publication and is updated daily on week days.
Initial download of the metrics may take a while.