| Issue |
A&A
Volume 688, August 2024
|
|
|---|---|---|
| Article Number | C3 | |
| Number of page(s) | 3 | |
| Section | Cosmology (including clusters of galaxies) | |
| DOI | https://doi.org/10.1051/0004-6361/202450702e | |
| Published online | 15 August 2024 | |
KiDS-1000: Combined halo-model cosmology constraints from galaxy abundance, galaxy clustering, and galaxy-galaxy lensing (Corrigendum)
1
Ruhr University Bochum, Faculty of Physics and Astronomy, Astronomical Institute (AIRUB), German Centre for Cosmological Lensing, 44780 Bochum, Germany
e-mail: This email address is being protected from spambots. You need JavaScript enabled to view it.
2
Institute for Astronomy, University of Edinburgh, Royal Observatory, Blackford Hill, Edinburgh EH9 3HJ, UK
3
E. A. Milne Centre, University of Hull, Cottingham Road, Hull HU6 7RX, UK
4
Donostia International Physics Center, Manuel Lardizabal Ibilbidea 4, 20018 Donostia, Gipuzkoa, Spain
5
Department of Physics and Astronomy, University College London, Gower Street, London WC1E 6BT, UK
6
Center for Theoretical Physics, Polish Academy of Sciences, al. Lotników 32/46, 02-668 Warsaw, Poland
7
Institute for Theoretical Physics, Utrecht University, 3584CC Utrecht, The Netherlands
8
Leiden Observatory, Leiden University, PO Box 9513 2300 RA Leiden, The Netherlands
9
Department of Computer Science, University of British Columbia, 6224 Agricultural Road, Vancouver, BC V6T 1Z1, Canada
10
Kobayashi-Maskawa Institute for the Origin of Particles and the Universe (KMI), Nagoya University, Nagoya 464-8602, Japan
11
Institute for Advanced Research, Nagoya University, Nagoya 464-8601, Japan
12
Kavli Institute for the Physics and Mathematics of the Universe (WPI), The University of Tokyo Institutes for Advanced Study, The University of Tokyo, Chiba 277-8583, Japan
13
Center for Gravitational Physics and Quantum Information, Yukawa Institute for Theoretical Physics, Kyoto University, Kyoto 606-8502, Japan
14
Argelander-Institut für Astronomie, Universität Bonn, Auf dem Hügel 71, 53121 Bonn, Germany
Key words: gravitational lensing: weak / methods: statistical / cosmological parameters / galaxies: haloes / dark matter / errata, addenda
This erratum provides a correction to the original paper (Dvornik et al. 2023) by updating Fig. 4 with the correct data. In Fig. 4 of the original paper, the data that were presented contained a factor of 1/h3 in the amplitude of both data and the model. In our analysis we used the correct data and the covariance matrix and the error was only introduced during the creation of the figures, thus influencing only our plotting scripts and the final figure. The mistake neither affected the results of the paper nor the conclusions from which they were drawn. In Fig. 1 we show the old wrong figure; Fig. 2 shows the correct data and model plots replacing the original figure. In Fig. 3 we show the correct data compared to the measurements from the GAMA survey (Driver et al. 2022) and predictions from the IllustrisTNG simulation (Nelson et al. 2018). The differences between our data and predictions from IllustrisTNG will be explained in the upcoming paper by Mahony et al. (in prep.).
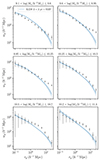 |
Fig. 1. Old Fig. 4 as presented in the original paper. |
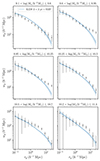 |
Fig. 2. New Fig. 4, showing the correct data and best-fit model. |
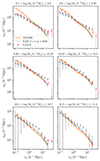 |
Fig. 3. Comparison of the KiDS Bright clustering data to the clustering data from the GAMA survey employing a similar selection of lens galaxies (in red) and hydrodynamical simulations (IllustrisTNG in orange). |
Acknowledgments
We thank Christos Georgiou for providing measurements from the GAMA survey to cross-check the data. Author contributions: Majority of work for this corrigendum was done by CM. The authorship list reflects the lead authors (AD, CH, MA, CM, BJ) followed by an alphabetical group that includes those who are key contributors to the scientific analysis.
References
- Driver, S. P., Bellstedt, S., Robotham, A. S. G., et al. 2022, MNRAS, 513, 439 [NASA ADS] [CrossRef] [Google Scholar]
- Dvornik, A., Heymans, C., Asgari, M., et al. 2023, A&A, 675, A189 [NASA ADS] [CrossRef] [EDP Sciences] [Google Scholar]
- Nelson, D., Springel, V., Pillepich, A., et al. 2018, ArXiv e-prints [arXiv:1812.05609] [Google Scholar]
© The Authors 2024
 Open Access article, published by EDP Sciences, under the terms of the Creative Commons Attribution License (https://creativecommons.org/licenses/by/4.0), which permits unrestricted use, distribution, and reproduction in any medium, provided the original work is properly cited.
This article is published in open access under the Subscribe to Open model. This email address is being protected from spambots. You need JavaScript enabled to view it. to support open access publication.
All Figures
|
Fig. 1. Old Fig. 4 as presented in the original paper. |
| In the text | |
|
Fig. 2. New Fig. 4, showing the correct data and best-fit model. |
| In the text | |
|
Fig. 3. Comparison of the KiDS Bright clustering data to the clustering data from the GAMA survey employing a similar selection of lens galaxies (in red) and hydrodynamical simulations (IllustrisTNG in orange). |
| In the text | |
Current usage metrics show cumulative count of Article Views (full-text article views including HTML views, PDF and ePub downloads, according to the available data) and Abstracts Views on Vision4Press platform.
Data correspond to usage on the plateform after 2015. The current usage metrics is available 48-96 hours after online publication and is updated daily on week days.
Initial download of the metrics may take a while.