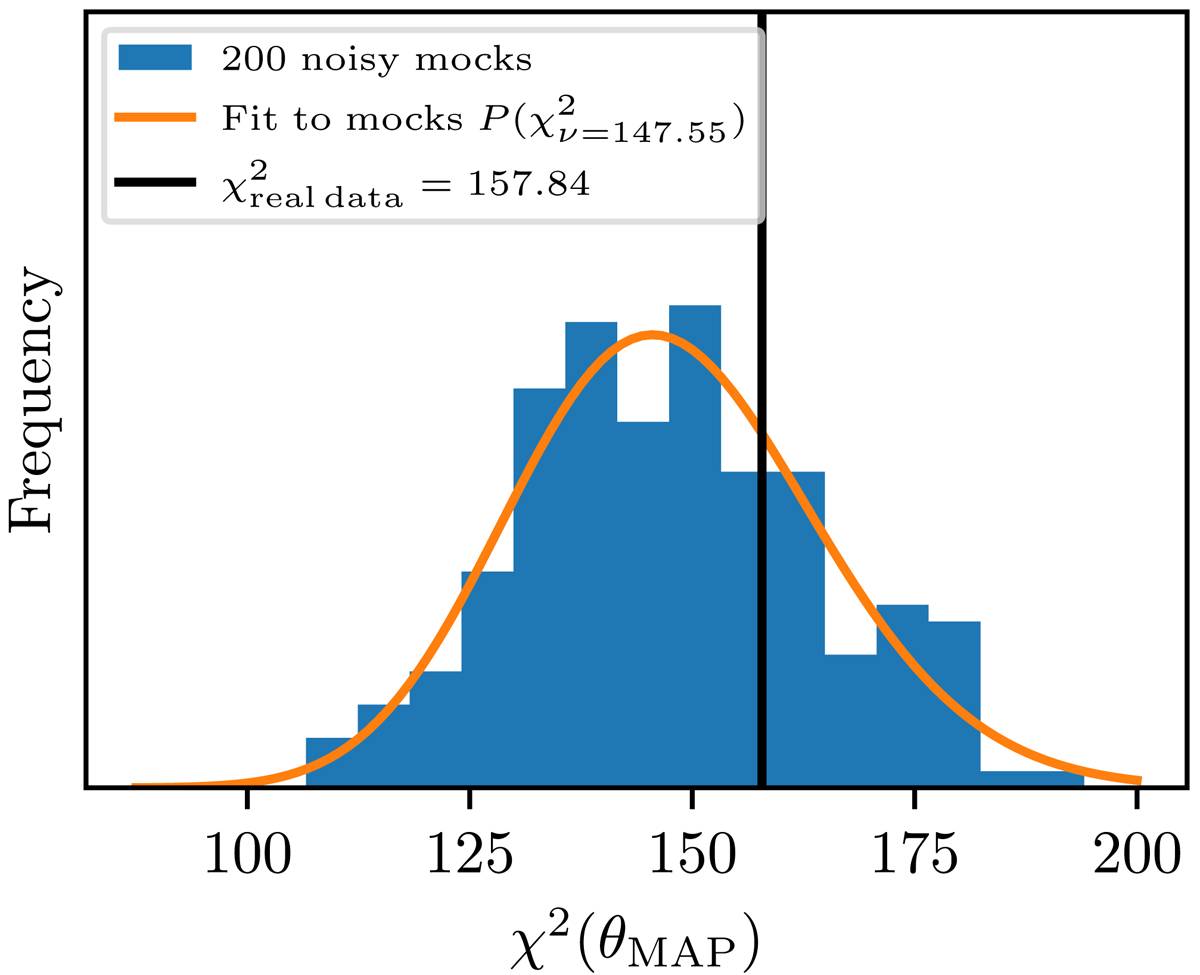
Fig. C.1.
Download original image
Estimation of the goodness of fit of the fiducial best-fit model at the MAP values. The histogram shows the distribution of the χ2 values from 200 noisy mock data vectors (see the main text for the detailed procedure). The orange line shows the fit of the χ2 distribution to the histogram, from which we obtain the effective number of degrees of freedom in the data. The vertical black line shows the χ2 value as obtained from the best-fit model to the real data.
Current usage metrics show cumulative count of Article Views (full-text article views including HTML views, PDF and ePub downloads, according to the available data) and Abstracts Views on Vision4Press platform.
Data correspond to usage on the plateform after 2015. The current usage metrics is available 48-96 hours after online publication and is updated daily on week days.
Initial download of the metrics may take a while.