Fig. 1.
Download original image
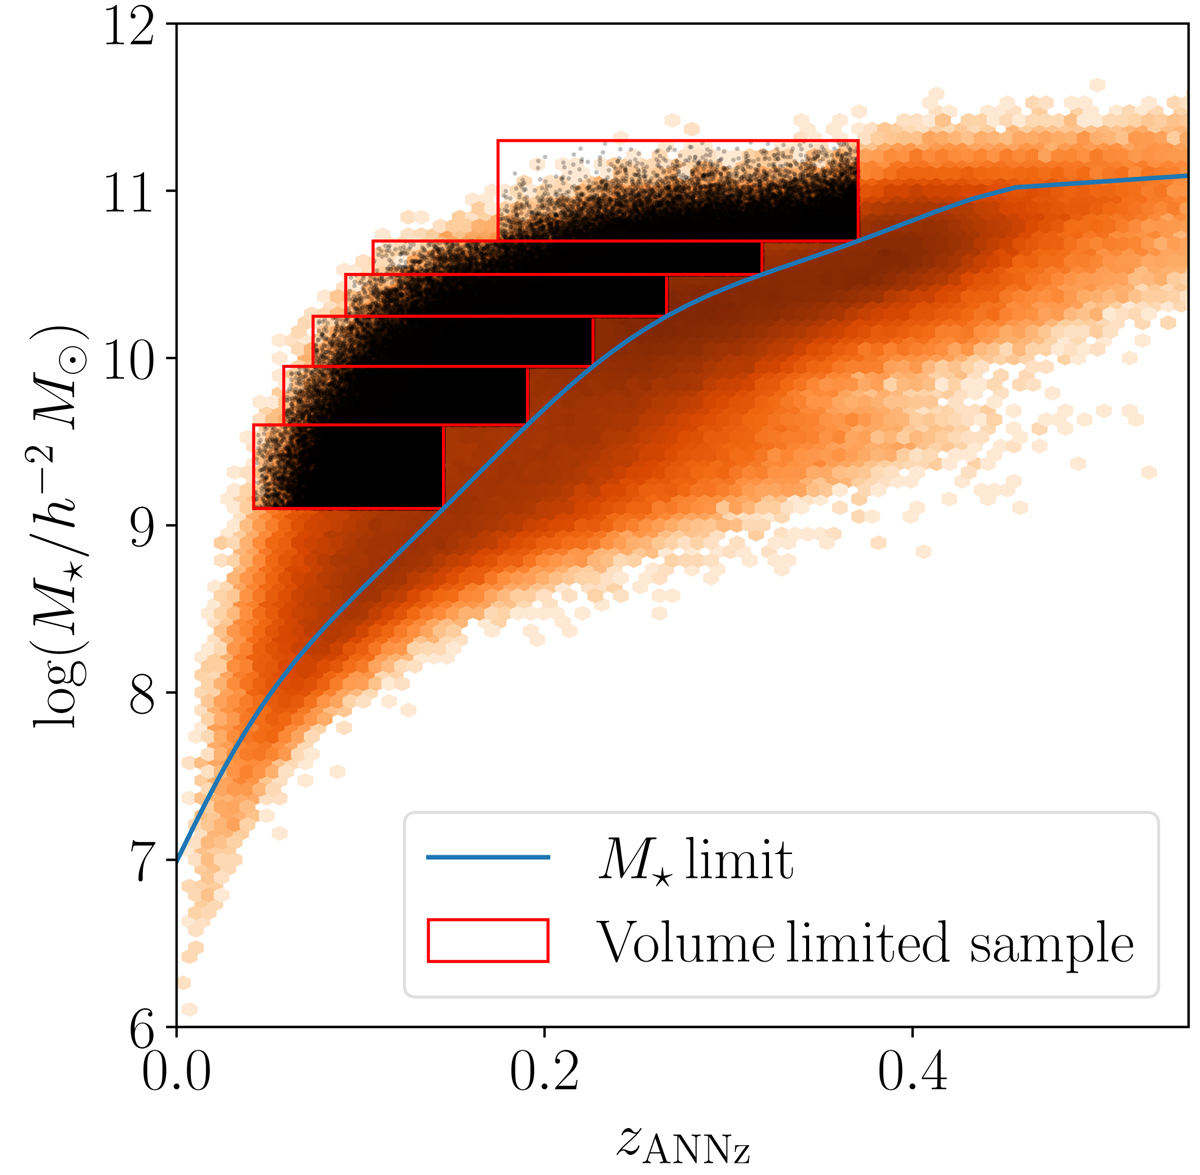
Galaxy stellar mass as a function of ANNz2 photometric redshift for the KiDS-Bright sample. The full sample is shown with a logarithmic hexagonal density plot. The blue line shows the stellar mass limit determined using the automated method presented by Wright et al. (2017). Red boxes show the six stellar mass bins used in the analysis, with individual galaxies plotted as black dots. The bin ranges were chosen in such a way as to achieve a good signal-to-noise ratio in all bins for our galaxy-galaxy lensing and galaxy clustering measurements.
Current usage metrics show cumulative count of Article Views (full-text article views including HTML views, PDF and ePub downloads, according to the available data) and Abstracts Views on Vision4Press platform.
Data correspond to usage on the plateform after 2015. The current usage metrics is available 48-96 hours after online publication and is updated daily on week days.
Initial download of the metrics may take a while.