| Issue |
A&A
Volume 674, June 2023
|
|
|---|---|---|
| Article Number | A66 | |
| Number of page(s) | 12 | |
| Section | Planets and planetary systems | |
| DOI | https://doi.org/10.1051/0004-6361/202345944 | |
| Published online | 01 June 2023 | |
New constraints on the presence of debris disks around G 196-3 B and VHS J125601.92–125723.9 b
1
Max-Planck-Institut für Astronomie,
Königstuhl 17,
69117
Heidelberg,
Germany
e-mail: zakhozhay@mpia.de
2
Main Astronomical Observatory, National Academy of Sciences of Ukraine,
03143
Kyiv,
Ukraine
3
Centro de Astrobiología, CSIC-INTA, Crta.
Ajalvir km 4,
28850
Torrejon de Ardoz, Madrid,
Spain
4
Instituto de Astrofísica de Canarias (IAC),
Calle Vía Láctea s/n,
38205
La Laguna, Tenerife,
Spain
5
Universidad de La Laguna, Dpto. Astrofísica,
38206
La Laguna, Tenerife,
Spain
6
Departament d’Astronomia i Astrofísica, Universitat de Valencia,
C. Dr. Moliner 50,
46100
Burjassot, Valencia,
Spain
7
Observatori Astronomic, Universitat de Valencia, Parc Científic,
C. Catedrático José Beltrán 2,
46980
Paterna, Valencia,
Spain
8
Universidad Internacional de Valencia (VIU),
C/ Pintor Sorolla 21,
46002
Valencia,
Spain
9
Janusz Gil Institute of Astronomy, University of Zielona Góra,
Lubuska 2,
65–265
Zielona Góra,
Poland
10
Department of Chemistry, Ludwig Maximilian University,
Butenandtstr. 5–13,
81377
Munich,
Germany
11
Instituto de Astrofísica de Andalucía, Consejo Superior de Investigaciones Científicas (CSIC),
Glorieta de la Astronomía s/n,
18008
Granada,
Spain
12
Facultad de Ciencias, Universidad de Zaragoza,
Pedro Cerbuna 12,
50009
Zaragoza,
Spain
13
School of Sciences, European University Cyprus,
Diogenes street, Engomi,
1516
Nicosia,
Cyprus
14
Institut de Radioastronomie Millimétrique (IRAM),
300 rue de la Piscine,
38406
Saint-Martin-d’Hères,
France
Received:
18
January
2023
Accepted:
13
March
2023
Context. The existence of warm (protoplanetary) disks around very young isolated planetary and brown dwarf mass objects is known based on near- and mid-infrared flux excesses and millimeter observations. These disks may later evolve into debris disks or rings, although none have been observed or confirmed so far. Little is known about circum(sub)stellar and debris disks around substellar objects.
Aims. We aim to investigate the presence of debris disks around two of the closest (~20 pc), young substellar companions, namely G196-3 B and VHS J125601.92–125723.9 b (VHS J1256–1257 b), whose masses straddle the borderline between planets and brown dwarfs. Both are companions at wide orbits (≥100 au) of M-type dwarfs and their ages (50–100 Myr and 150–300 Myr, respectively) are thought to be adequate for the detection of second-generation disks.
Methods. We obtained deep images of G196-3 B and VHS J1256–1257 b with the NOrthern Extended Millimeter Array (NOEMA) at 1.3 mm. These data were combined with recently published Atacama Large Millimeter Array (ALMA) and Very Large Array (VLA) data of VHS J1256–1257 b at 0.87 mm and 0.9 cm, respectively.
Results. Neither G196-3 B nor VHS J1256–1257 b were detected in the NOEMA, ALMA, and VLA data. At 1.3 mm, we imposed flux upper limits of 0.108 mJy (G196-3 B) and 0.153 mJy (VHS J1256–1257 b) with a 3-σ confidence. Using the flux upper limits at the millimeter and radio wavelength regimes, we derived maximum values of 1.38×10⁻² MEarth and 5.46 × 10⁻³ MEarth for the mass of any cold dust that might be surrounding G196-3 B and VHS J1256–1257 b, respectively.
Conclusions. We put our results in the context of other deep millimeter observations of free-floating and companion objects with substellar masses smaller than 20 MJup and ages between approximately one and a few hundred million years. Only two very young (2–5.4 Myr) objects are detected out of a few tens of them. This implies that the disks around these very low-mass objects must have small masses, and possibly reduced sizes, in agreement with findings by other groups. If debris disks around substellar objects scale down (in mass and size) in a similar manner as protoplanetary disks do, millimeter observations of moderately young brown dwarfs and planets must be at least two orders of magnitude deeper to be able to detect and characterize their surrounding debris disks.
Key words: planets and satellites: formation / protoplanetary disks / brown dwarfs / submillimeter: planetary systems
© The Authors 2023
 Open Access article, published by EDP Sciences, under the terms of the Creative Commons Attribution License (https://creativecommons.org/licenses/by/4.0), which permits unrestricted use, distribution, and reproduction in any medium, provided the original work is properly cited.
This article is published in open access under the Subscribe to Open model.
Open Access funding provided by Max Planck Society.
1 Introduction
Substellar objects are known to host accretion and protoplanetary disks in a similar way as stars. The first pieces of evidence of disks around brown dwarfs were given by the presence of strong and resolved Hα emission line and near- and mid-infrared excesses (Natta & Testi 2001; Jayawardhana et al. 2002, 2003; Muzerolle et al. 2003, 2005; Pascucci et al. 2003; Natta et al. 2004; Mohanty et al. 2005). The frequency of protoplanetary disks around brown dwarfs has been investigated in several star-forming regions, such as Taurus, IC 348, Chamaeleon, σ and λ Orionis, ρ Ophiuchus, Upper Scorpius, and TW Hya, all regions with less than 20 Myr, resulting in a rate (~40%) very similar to that of low-mass stars (Luhman et al. 2005, 2006, 2010; Luhman & Mamajek 2012; Guieu et al. 2007; Damjanov et al. 2007; Caballero et al. 2007; Zapatero Osorio et al. 2007; Hernández et al. 2007; Barrado y Navascués et al. 2007; Bouy et al. 2007; Scholz et al. 2007; Scholz & Jayawardhana 2008; Alcalá et al. 2008; Riaz & Gizis 2008; Riaz et al. 2009; Peña Ramírez et al. 2012; Alves de Oliveira et al. 2013). Spatially resolved images of protoplanetary disks surrounding massive brown dwarfs and proto-brown dwarfs in young star-forming regions have also been obtained thanks to the power of the Atacama Large Millimeter Array (ALMA) observations (Ricci et al. 2014; Testi et al. 2016; Riaz et al. 2019; Rilinger & Espaillat 2021). These data indicate that the masses and sizes of young circumsubstellar disks are a scaled version of the disks around low-mass stars.
Protoplanetary disks around brown dwarfs show evidence of growth toward planetesimals (Apai et al. 2005; Ricci et al. 2014) and are expected to evolve into debris disks or rings. The timescale for the protoplanetary-to-debris transition in the substellar regime has not been well established so far and may depend from case to case. Preliminary studies suggest that brown dwarf disks transition to the debris phase by ~40–50 Myr ages (Riaz & Kennedy 2014). In the stellar regime, protoplanetary disks with large amounts of gas survive up to ~ 10 Myr (Wyatt et al. 2015, and references therein). Based on the high frequency of circumsubstellar disks at very young ages, debris disks as descendants of the original disks around brown dwarfs should be common as well. But none are known or have been confirmed to date to the best of our knowledge. Two candidates have been reported in the literature. V1400 Cen is a young, solar-mass star of the Sco-Cen OB association with an age of about 16 Myr. This star exhibited a remarkably long, deep, and complex eclipse event that was interpreted as it being eclipsed by a low-mass object (likely a brown dwarf or planet) orbited by a dense inner disk (Mamajek et al. 2012; Kenworthy & Mamajek 2015). In a subsequent paper, Kenworthy et al. (2020) recently reported a nondetection of any flux in ALMA Band 7 with an upper limit 3-σ level of 57.6 μJy at the position of the star. The authors conclude that the hypothesized bound ring system is composed of dust smaller than 1 mm in size, implying a young ring structure. The second candidate is G196-3 B (L3 spectral type), the brown dwarf companion to a low-mass star with an age in the interval 50–100 Myr (Rebolo et al. 1998). Zakhozhay et al. (2017) argue that a feasible scenario to account for the very red colors of the L3 dwarf is the presence of a debris disk or ring. The lack of evidence of substellar debris disks is likely because many of the known brown dwarfs are old, lie at far distances, or remain unresolved from their more massive primaries.
The aim of our current study is to investigate the possibility of a circumplanetary or debris disk presence in two substellar companions that reunite unique conditions of youth, proximity, and companion–host separation: VHS J125601.92–125723.9 b (from now on VHS J1256–1257 b) and G196-3 B. In this paper, we introduce the targets in Sect. 2 and present the results of the 0.9 mm and 1.3 mm observations in Sect. 3. The mass upper limits of any hypothetical cold dusty disk surrounding the targets are calculated in Sect. 4. Discussion and conclusions are presented in Sects. 5 and 6.
2 Target selection
VHS J1256–1257 is a multiple system that formed by at least three low-mass objects, which is exceptional for its proximity, 22.2 pc, and young age, 150–300 Myr (Gauza et al. 2015; Stone et al. 2016; Dupuy et al. 2020). VHS J1256–1257 comprises an M7.5 primary component, which is actually an equal-magnitude close binary with a separation of 123 mas as revealed by the adaptive optics observations of Stone et al. (2016), and one L7±1.5 companion that lies at a distance of 8″ from the binary (Gauza et al. 2015). According to evolutionary models (Chabrier et al. 2000), both components of the binary have equal effective temperatures of Teff ≈ 2620 K (Stone et al. 2016) and masses of M* = 60–100 MJup (Dupuy et al. 2020). The mass of the L7 companion is estimated in the interval 10–35 MJup. In the work by Dupuy et al. (2020), based on the trigonometric parallax of  pc1, the authors derived a mass of 19±5 MJup and a temperature of 1240 ± 50 K for VHS J1256–1257 b. More recently, Dupuy et al. (2023), using Keck adaptive optics imaging and aperture-masking interferometry, determined the primary binary orbit (a =1.96 ± 0.03 au, P = 7.1 ± 0.02 yr) and measured its dynamical total mass (0.141 ± 0.008 M⊙), which is consistent with it being a brown dwarf or very low-mass stellar binary of 70–80 MJup. The brightness, relatively wide orbit, and a lower contrast between the host star than in the case of other known directly imaged exoplanets, make VHS J1256–1257 b an exceptional object of which a thorough characterization is feasible. For example, intense photometric monitoring of this object has shown that this is the coolest object with larger photometric variability currently known (Bowler et al. 2020; Zhou et al. 2022). More recently, an intermediate-resolution near-infrared spectrum of this object has been obtained with X-Shooter (Petrus et al. 2023) and James Webb Space Telescope (JWST) has obtained a high fidelity 1–20 μm spectrum (Miles & High Contrast Imaging of Exoplanets JWST ERS Team 2023), which indicate the presence of water, methane, carbon monoxide, carbon dioxide, sodium, and potassium in its atmosphere, becoming a reference for exoplanet research. The spectral shape of VHS J1256–1257 b seems to be influenced by disequilibrium chemistry and silicate clouds.
The Gaia Early Data Release 3 (EDR3; Gaia Collaboration 2016; Lindegren et al. 2021) provides a distance of 21.15±0.21 pc for the primary binary component. This is the value we adopted for this paper. With this new determination and following the approach explained in Gauza et al. (2015), the mass of VHS J1256–1257 b turns out to be  MJup, using the BT-Settl evolutionary models (Baraffe et al. 1998, 2003; Chabrier et al. 2000) with the Caffau et al. (2011) solar abundances and the luminosity of log(L/L⊙) = −4.57 ± 0.2, which we computed from the observed flux integration following the procedure described in Zakhozhay et al. (2017). Uncertainty in the mass determination reflects the range of possible masses from the models given the age and luminosity in BT-Settl models. VHS J1256–1257 b is confirmed to be young for its spectroscopic properties, revealing a low-gravity atmosphere summarized by Gauza et al. (2015). What is relevant for this work is the remarkable photometric property of VHS J1256–1257 b: it is a very red source with near- and mid-infrared colors in excess with respect to dwarfs of related spectral types. In fact, VHS J1256–1257b is one of the reddest dwarfs known in the literature.
G 196-3 B is the  MJup, L3-type substellar companion of the nearby, high proper motion, M2.5 star G196-3 A (Rebolo et al. 1998). The system has a projected orbital size of 16″ at the parallactic distance of 21.81 ± 0.01 pc (Gaia Collaboration 2016; Lindegren et al. 2021). The youth of G196-3 B (50–100 Myr) is confirmed by the vast amount of optical and near-infrared spectroscopic observations: strong Li I and weak Na I and K I absorption, strong VO and H2O bands, plus the peaked H-band continuum (Martín et al. 1999; Kirkpatrick et al. 2001; McGovern et al. 2004; McLean et al. 2007; Allers et al. 2007; Zapatero Osorio et al. 2014). As VHS J1256–1257b, G196-3 B, with Teff ≈ 1850 K, also has very red colors that clearly deviate from the indices of field dwarfs of a similar spectral classification (Zapatero Osorio et al. 2010). This reddening behavior is not observed in younger (lower gravity) objects of related temperatures (Lodieu et al. 2013; Peña Ramírez et al. 2012; Zapatero Osorio et al. 2017). Alternatively, Zakhozhay et al. (2017) studied the physical feasibility of a debris disk being responsible for the infrared flux excesses. The authors modeled the spectral energy distribution (SED) of G196-3B from the optical through 24 μm and found that the best-fit solution is provided by a combination of an unreddened L3 atmosphere and a warm (~ 1300 K), optically thick, narrow debris disk (“ring”) containing submicron particles and a mass ≥7 × 10⁻¹⁰ Mearth located very near the central substellar object. Such a disk may resemble the rings of Neptune and Jupiter, except for its high temperature.
3 Observations and data reduction
3.1 NOEMA
We observed both systems VHS J1256–1257 and G196-3 B using ten 15-m antennas of the NOrthern Extended Millimeter Array (NOEMA). NOEMA is currently the most advanced millimeter interferometer in the Northern Hemisphere situated at 2550 m on the Plateau de Bure in the French Alps2. The interferometer is equipped with a high-performance wide-band correlator named PolyFiX3.
All antennas are equipped with 2SB receivers, which provide low noise performance and long-term stability. Observations were performed on 2019 March 25 and 27 for VHS J1256–1256 and G 196-3 B, respectively. We used NOEMA in compact configuration D, with baselines between 24 and 176 m. This configuration allowed us to obtain images at 1.3 mm (230 GHz) with an angular resolution of 2.″53 × 1.″43 at 0° for VHS J1256–1257 and 1.″73 × 1.″33 at 64° for G196-3 B. The NOEMA field of view of 21.″9 at 1.3 mm was centered at the middle distance between the primary and the companion of VHS J1256–1257 and at the substellar companion G196-3 B (the primary G196-3 A was outside of the field of view). The total on-source integration time was 1.5 h for VHS J1256–1257 and 2.1 h for G196-3 B.
Data calibration was performed with GILDAS-CLIC software (Sep-2019 version)4. The continuum was obtained by averaging line-free channels over the 7.744 MHz width (USB) centered at 230.0 GHz. We obtained a root mean square (rms) noise of 0.051 mJy beam−1 (1-σ) for VHS J1256–1257 b and 0.036 mJy beam−1 (1-σ) for G196-3 B in the synthesized beam, corresponding to minimum detected signals of 0.153 mJy and 0.108 mJy (adopting a 3-σ detection limit). Images were cleaned using robust weighting with Högbom’s method (Högbom 2003) and a robust parameter of three. To obtain the convergence of the flux, 1700 iterations were used. Nevertheless, even by tapering baselines above 50 m projected length, no detections were found.
3.2 ALMA
ALMA observations were obtained for the VHS J1256–1257 system on 2019 March 07 between 5:22 and 07:27 UT using 43 of the ALMA 12 m antennas in Band 7 or ~0.9 mm (G196-3 is not observable from the ALMA latitude). The main scientific objective was to detect the continuum emission from a possible disk around the companion VHS J1256–1257 b. The central binary VHS J1256–1257 AB was observed simultaneously as it lies at the northwestern border of the ALMA field of view. Two ALMA execution blocks were carried out, yielding a total on-source time of 73 min. The configuration was nominally TM1. The longest baseline was 313 m long, while the shortest was 15 m. This resulted in a synthetized beam of 0.″91 × 0.″81 with a position angle (PA) of −84.8°. The precipitable water vapor (PWV) in the atmosphere above ALMA was between 1.21 mm and 1.26 mm during the observations. We used a full continuum sensitivity configuration. However, we adopted a mixed spectral (line and continuum) setup to maximize the potential scientific outcome of the project by also measuring the CO 3–2 line at 345.8 GHz in base-band 1 with a spectral resolution of 0.98 km s−1 covering a bandwidth of 1.875 GHz (1920 channels). Base-band 2 was centered 1.8 GHz below the central frequency (344.0 GHz) to cover 2 GHz at a lower resolution (27.2 km s−1; 128 channels). Likewise, the other two base bands were centered at the standard image band frequencies (357.8 and 356.0 GHz, respectively). Flux, band-pass, and phase calibrators were observed following the standard ALMA calibration procedure; VHS J1256–0547 served as aband-pass and flux calibrator, while J1305–1033 was used as a phase calibrator.
The calibration of the ALMA data followed the standard ALMA quality assurance procedure for Cycle 6 using the calibration pipeline 42254 (ALMA pipeline team5) based on the CASA data analysis package version 5.4.-70 (McMullin et al. 2007). The calibrated data were then imaged with the tclean task of the same CASA package in mfs mode, that is, combining all spectral channels into one image. VHS J1256–1257 data were imaged as a single field with a pixel size of 0.″16 and natural weighting in order to optimize the point-source sensitivity. No significant sources were found in the final image, resulting in an rms noise in the central region of 0.02 mJy beam−1 (1-σ).
The same NOEMA and ALMA data of VHS J1256–1257 are presented in Climent et al. (2022), where the peculiar emission of the primary component is examined in detail. Here, we focus on the very low-mass companions VHS J1256–1257 b and G196-3 B. To complement the NOEMA and ALMA data of VHS J1256–1257 b, we also used the Karl G. Jansky Very Large Array (VLA) data at 6 GHz and 33 GHz (5 and 0.9 cm) of Climent et al. (2022). While the (unresolved) primary component was clearly detected at both frequencies, the companion VHS J1256–1257 b remained below the sensitivity of the final VLA images with a 1-σ rms noise of 0.004 and 0.010 mJy beam−1 at 6 GHz and 33 GHz.
4 Dusty disk mass upper limits
Neither VHS J1256–1257 b nor G196-3 B are detected at the NOEMA 1.3-mm band. In addition, VHS J1256–1257 b remains undetected at the shorter ALMA and longer VLA wavelengths. There is no thermal emission detectable at the depth of our submillimeter, millimeter, or centimeter observations, which may robustly confirm the presence of surrounding disks. We built the SEDs of both targets by adopting the flux upper limits with a 3-σ confidence for all NOEMA, ALMA, and VLA data. To complete the optical through mid-infrared wavelengths, we compiled all available photometry and spectroscopy from the literature (see references in Zapatero Osorio et al. 2010; Gauza et al. 2015; Guirado et al. 2018; Climent et al. 2022). Figure 1 shows the final SEDs.
To compute the mass upper limits on any hypothetical dusty disk surrounding VHS J1256–1257 b and G196-3 B, we used the following equation (Beckwith et al. 1990; Ricci et al. 2017), which is valid for optically thin, gas-depleted disks (i.e., we assumed that very little gas is left by the ages of our targets):

where d is the distance to the source, Bν(Td) is the Planck function evaluated at the characteristic temperature of the emitting dust (Td), and Fν is the continuum flux density at the given frequency ν. The wavelength-dependent opacity κν was calculated for the NOEMA and ALMA data using the code OpacityTool available through the DIANA (DIscANAlysis) project6 introduced by Woitke et al. (2016) and for the default dust parameters therein7, except for the dust particles’ size distribution that we used for the range from 0.1 to 100 μm. For the VLA wavelengths, we used the extrapolation of the Beckwith et al. (1990) opacities to longer wavelengths8. We note that κν suffers from a large uncertainty since it depends not only on the dust physical properties (e.g., Semenov et al. 2003; Woitke et al. 2016), but on the physical processes happening inside the disk as well (e.g., Isella et al. 2014; Wu et al. 2022).
The temperature of the dust was evaluated using the relation of van der Plas et al. (2016): Td = a (L*/L⊙)b, where L*/L⊙ is the bolometric luminosity of the disk-host source in solar units, and a and b are coefficients dependent on the disk size9. As in Shabram & Boley (2013) and Rab et al. (2019), for our targets, we assumed the disk outer radius (Rd) as that given by third of the Hill sphere radius10:

where m and M correspond to the masses of the substellar companion and the primary, and r stands for their orbital separation.
We made the general assumption that disk-host companions at separations larger than 220 au from their primaries are far enough and the disk heating from the companions dominates over the hitting induced by the brighter primaries (i.e., a companion can be considered as an isolated object). G196-3 B falls in this category, but VHS J1256–1257 b lies closer to its primary. For this “close” companion, we computed the characteristic dust temperature assuming  , where Tir is a temperature evaluated from the heat balance equation between the host source and the dust, roughly assuming that the distance to the dust is equal to the separation of the companion and that there is no disk material in between them.
For VHS J1256–1257 b and G196-3 B, we inferred sizes of the disks of Rd max ~ 18 and ~30 au, respectively. These values are provided in Tables 1 and 2 together with the characteristic cold temperatures of the dusty disks. To determine the mass upper limits on the putative disks around our targets, we used the observations providing the most constraining results: the NOEMA datum for G196-3 B and the ALMA datum for VHS J1256–1257 b. The SEDs of the cold disks containing the computed maximum dust masses are illustrated in Fig. 1; the maximum mass values are listed in Table 2 in units of the Earth mass.
Physical properties and information of millimeter and submillimeter observations of brown dwarfs and planetary-mass objects with nondetected disks.
 |
Fig. 1 Observed spectral energy distributions (SEDs) of the substellar companions VHS J1256–1257 b (left panel) and G196-3 B (right panel) are shown with blue circles (measured photometry), triangles (flux upper limits), and black lines (observed optical and near-infrared spectra). The new 3-σ flux upper limits on the NOEMA, ALMA, and VLA data reported here are displayed in red color. The theoretical BT-Settl photospheric spectrum corresponding to the Teff of each target is shown with the solid gray line (Allard et al. 2003, 2012). In the right panel, we also illustrate with the dotted line the best model (photosphere and the hot ring) derived for G196-3 B by Zakhozhay et al. (2017). The solid red line stands for the SEDs of putative cold dusty disks computed as explained in the text. |
Radius and mass upper limits and temperature of potential dusty disks around brown dwarf and planets with nondetections.
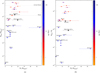 |
Fig. 2 Upper limits (triangles) on the cold disk dust mass as a function of the mass of the companion for all substellar companions below ~20 MJup and with submillimeter and/or millimeter data published in the literature. The age of the systems is color-coded as illustrated by the color bar, except for our targets VHS J1256–1257 b (150–300 Myr) and G 196-3 B (50–100 Myr), which are shown with the black triangles. The left panel shows the upper limits on the dust mass in Earth mass units (MEarth), while the panel on the right shows the masses of the disks relative to the masses of the substellar hosts. Horizontal solid gray lines in the left panel depict the masses of the Moon and of the Jovian moons. The two confirmed circumsubstellar protoplanetary disks around SR 12 c and PDS 70 c are shown with hexagons. The disk dust masses were computed using the approach described in Sect. 4. Several objects, some of which are mentioned in the text, are labeled. |
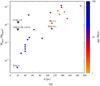 |
Fig. 3 Upper limits on the dust mass (triangles) versus distance for all objects of Table 1. Colored pentagons stand for the two known protoplanetary disks around SR 12 c and PDS 70 c. The age of the systems is color-coded as illustrated by the color bar, except for our targets VHS J1256–1257 b (150–300 Myr) and G 196-3 B (50–100 Myr), which are shown with the black triangles. The disk dust masses were computed using the approach described in Sect. 4. |
5 Discussion
5.1 Comparison to other substellar companions
We put our observations and results in the context of other substellar companions of a similar mass with available long-wavelength observations. Over the past few years, a number of millimeter and submillimeter observations targeting the circumplanetary or debris disks ended up with mostly nondetections (Booth et al. 2016; Wu et al. 2017, 2020; Ricci et al. 2017; Su et al. 2017; Pérez et al. 2019; Matrà et al. 2019; Pineda et al. 2019). Only two circumplanetary disks have been confirmed around the substellar companions PDS 70 c and SR 12 c (Benisty et al. 2021; Wu et al. 2022). Table 1 lists all companions with masses smaller than ~20 MJup that have been scrutinized for their cold disks using NOEMA, VLA, and/or ALMA observations and for which only flux density upper limits are available. Their ages oscillate between one and a few hundred million years. We compiled the mass determinations of each source from the literature and show the most likely values in Table 1. β Pic b has a dynamical mass derived by Lacour et al. (2021). The companion PZ Tel B was first published as a 3.2–24.4 MJup companion by Schmidt et al. (2014). Its mass was later revised to 38–72 MJup by Maire et al. (2016), which is the value we employed in our work.
Then, we computed dust mass upper limits for all objects in Table 2 following the procedure described in Sect. 4. Excluded from Tables 1 and 2 are LkCa15 b and HD 100546 b, which are presented in Ricci et al. (2017) and Pineda et al. (2019), because their substellar mass and luminosity parameters are very uncertain. Moreover, the existence of the companions is questioned in the literature. In the case of LkCa15 b, Currie et al. (2019) claim that all previously suspected planetary companions of the LkCa15 system (LkCa15 b,c,d) are most likely signals from the disk inner structure of the primary based on new near-infrared direct imaging and spectroscopy collected with Subaru Coronagraphic Extreme Adaptive Optics system coupled with Coronagraphic High Angular Resolution Imaging Spectrograph (CHARIS) integral field spectrograph and multiepoch thermal infrared imaging from Keck/NIRC2. Also excluded is the V1400 Cen system (Mamajek et al. 2012; Kenworthy & Mamajek 2015; Kenworthy et al. 2020) because of the unconstrained mass of the companion (see also the Introduction section). Some of our mass upper limit estimates deviate from the literature values. GQLup B and GSC 6214-210 B’s maximum dust masses differ from the determinations presented in Ricci et al. (2017) because we are using new ALMA data published in Wu et al. (2017). The limits derived for PZTel B, 51 Eri b, AB Pic b, κ And b, HR8799 b,c,d,e, β Pic b, and HD 95086 b are also different by one order of magnitude when compared to those derived by Pérez et al. (2019). The main reason is the radiative transfer model (RADMC-3D) used by Pérez et al. (2019) that gives mostly lower dust temperatures by ~30 K for disk sizes in the interval 1–10 au (for more details see Sect. 3 of Pérez et al. 2019).
In support of the hypothesis that many of these objects can host a surrounding disk, van Holstein et al. (2021) recently obtained linear polarimetric images in the near-infrared for 20 known directly imaged exoplanets and brown dwarf companions, 11 of which are included in Table 1: PZ Tel B, AB Pic b, GSC 6214-2010 B, GQ Lup B, HR 8799 (b,c,d,e), 1 RXS1609 b, DH Tau B, and β Pic b. They reported the first detection of linear polarization from substellar companions, with a polarization degree of several tenths of a percent for DH Tau B and GSC 6214-210 B. Given the very young ages of the two objects, the authors assume that the polarization most likely originates from circumsubstellar protoplanetary disks. This interpretation also agrees with that of Miles-Páez et al. (2017), where two free-floating Taurus objects of late-M spectral types and brown dwarf masses were reported to have significant near-infrared linear polarization, in one case clearly correlated with mid-infrared flux excesses and thus consistent with the presence of a surrounding disk. For the rest of the van Holstein et al. (2021) sample, the authors have reported a null polarimetric detection but it does not necessarily mean an absence of disk. In fact, Christiaens et al. (2019) have announced evidence for a disk around PDS 70 b (included in the target list of van Holstein et al. 2021) based on near-infrared spectroscopic observations.
Figure 2 shows our computed upper limits on the disk dust mass as a function of the mass of the companion, which is the disk-host source. The left panel depicts the mass upper limits as measured while the right panel illustrates the mass upper limits normalized to the mass of the central companion to break any dependence of the disk dust mass on the mass or luminosity of the disk-host object. Both upper limits and the two solid detections are depicted together. As a reference, the masses of the rings of Saturn (Zakhozhay et al. 2017), the Moon, and total mass of the Jovian moons (Ricci et al. 2017) are also included in the left panel. Our targets are shown with dust mass upper limits of 0.014 MEarth (G196-3 B) and 0.005 MEarth (VHS J1256–1257 b). These measurements are on the order of magnitude of the mass of the Moon.
There is a clear observational bias in both panels of Fig. 2: the “older” objects (> 10Myr) have lower disk dust mass upper limits than the very young sources (≤ 10 Myr) because the former are typically located closer and, therefore, observations yield deeper absolute fluxes for them. This is better illustrated in Fig. 3, where the objects of Table 1 are depicted as a function of their distance. G196-3 B, VHS J1256–1257 b (our two targets), and β Pic b are the closest substellar companions for which an attempt to detect surrounding disks has been made to date. The β Pic b observations (Matrà et al. 2019) are actually quite deep and our dust mass upper limit estimate is about two orders of magnitude more restrictive for β Pic b than for our two targets (left panel of Fig. 3). Regarding the group of younger objects (typical distance ≥ 100 pc), where there are two positive disk detections, both Figs. 2 and 3 indicate that SR 12 c and PDS 70 c may host relatively “bright” disks and that observations have to be at least one order of magnitude deeper to be able to detect similar disks around the other very young brown dwarf companions included in the figures.
5.2 Comparison to free-floating sources
For a wider view, we also compared what is known for substellar companions to the situation of free-floating brown dwarfs and stars in Fig. 4, which shows the protoplanetary disk dust masses and dust mass upper limits using ALMA data provided by Testi et al. (2022) for the following star-forming regions and young star clusters: L1688 (in p-Ophiuchi), Taurus, Lupus, Corona Australis, Upper Scorpius, and Chameleon I. All of these regions are very young with typical ages below 10–20 Myr. For the computation of the disk dust masses around central objects with masses from substellar to several times the solar mass, Testi et al. (2022) adopted κν = 2.3 cm2 g−1 and a constant Tdust = 20 K.
For a proper comparison with the data of Testi et al. (2022), we redid our computations of the disk dust mass upper limits for the substellar companions following the same adoption11 (see also Pascucci et al. 2016). Our new computations (provided in Table 2), Testi et al. (2022) determinations, and Saturn’s rings (Zakhozhay et al. 2017) are displayed in the upper panel of Fig. 4, while the bottom panel shows the relative disk dust masses (disk mass over the mass of the central source) as a function of the disk-host object. The ages of the various objects are color-coded in Fig. 4. There are significant differences between our computations of disk dust mass upper limits and those obtained by adopting a constant dust temperature. As an example, our VHS J1256–1257 b estimate is 15 times larger than the one from the disk constant temperature. However, this difference is still within the large dispersion for a given mass of the central object as seen in Fig. 4.
Similarly to stars, the detection of disks surrounding substellar objects appears to drastically depend on the system’s age. The only submillimeter and millimeter detections in the substellar regime (OTS44, SR 12 c, and PDS 70 c) in Fig. 4 correspond to sources with an age of less than 10 Myr, while there is no single disk detection around brown dwarfs with older ages despite the observations being more sensitive (due to the closer distances). This could be explained by the natural evolution of the disks, which transists from protoplanetary to the debris phase. All three of them – OTS44, SR 12 c, and PDS 70 c – likely host protoplanetary disks in which gas accretion still takes place on the central objects.
As already pointed out by many groups, the mass of the protoplanetary disks linearly depends on the mass of the central object including the substellar regime. This implies that the disks around brown dwarfs are scaled-down versions of the stellar disks. As illustrated in the bottom panel of Fig. 4, for very young objects the relative disk dust masses appear to be constant for all stellar and substellar mass regimes, although with a relative large dispersion of about one order of magnitude. This implies that if planets form around substellar objects, the amount of dust mass available for planetary formation is small. Only rocky planets such as Earth or smaller could form unless more massive planets are raised in earlier stages (<1 Myr) when the substellar disks might have been more massive.
Because of the age of G196-3 B and VHS J1256–1257 b, we would expect them to host debris disks rather than protoplanetary disks. For completeness, we also included in both panels of Fig. 4 ALMA detections of circumstellar debris disks from Sepulveda et al. (2019), Marino et al. (2020), and Matrà (in prep.), and dust mass upper limits determined from the Sullivan et al. (2022) observations of Pleiades’ stellar members. All of these objects have typical ages greater than 20 Myr (the Pleiades’ age is 115 Myr, Stauffer et al. 1998; Sullivan et al. 2022). To determine the masses of all the central objects with detected debris disks (presented in Sepulveda et al. 2019 and Matrà, in prep.), we used a simple mass-luminosity relation  (where both parameters are in solar units) applicable to the masses >0.43 M⊙ (Duric 2003)12. For consistency, we computed the dust masses and dust mass upper limits for all debris disks (Sepulveda et al. 2019; Marino et al. 2020; Sullivan et al. 2022; Matrà, in prep.) following the approach of Testi et al. (2022).
In both panels of Fig. 4, stars with debris disks are located below the stars with protoplanetary disks. As expected, the dust mass of debris disks is significantly smaller than that of protoplanetary disks for a given central source. Interestingly, the sequence described by the debris disks appears to be parallel to that of the protoplanetary disks for the central object mass interval between ~0.5 and ~2 M⊙. Under the assumption that disks around brown dwarfs and planets of different ages behave similarly, that is, they scale down with the mass of the central body, the extrapolation of the debris disk stellar sequence into the substellar domain using the same decreasing slope observed for protoplanetary disks indicates that submillimeter and millimeter observations must be at least 100 times deeper than current observations in order to detect the presence of substellar debris disks surrounding moderately young brown dwarfs and planets. According to the bottom panel of Fig. 4, only the ALMA observations of VHS J1256–1257b marginally comply with this requirement, yet in the upper part there is large dispersion of the predicted debris disks dust masses. That is, current observations have largely missed substellar debris disks other than ruling out their existence. These observations are indeed challenging and require tens to hundreds of hours of observations with ALMA. Future interferometers, as SKA1-MID at high frequencies (Band 6, 15–50 GHz), with the added benefit of improved sensitivity and spatial resolution, could provide signicant contributions to the debris disks of these objects (Conway et al. 2020).
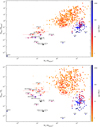 |
Fig. 4 Measured (top panel) and relative (bottom panel) disk dust masses (pentagons and circles, ALMA detections) and dust mass upper limits (triangles, mostly ALMA nondetections) as a function of the mass of the disk-host object. Data are taken from Table 2 and Testi et al. (2022), Sepulveda et al. (2019), Marino et al. (2020), Sullivan et al. (2022), and Matrà (in prep.). Upper limits of substellar companions and free-floating objects are shown with filled and open triangles, respectively. Computations of the dust masses and upper limits are based on the assumption of a constant temperature of the disk dust (see text). In the bottom panel, the three companions of HD 8799 (c,d,e) have the same estimated dust mass upper limits; we artificially shifted them vertically so it is visually noticeable that there are three data points. The ages of the disk-host sources are color-coded (see the bar to the right of the panels). Protoplanetary disks (i.e., very young ages) have yellowish to orangish colors, while debris disks (i.e., typically older than 20 Myr) have dark red, blue, and dark blue colors, with the exception of our two targets (G196-3 B and VHS J1256–1257 b) plotted as black triangles. |
6 Conclusions
In this paper we have presented the results of NOEMA (1.3 mm) observations of G 96-3 B ( MJup), and ALMA (0.87 mm), NOEMA (1.3 mm), and VLA (0.9 cm and 5 cm) observations of VHS J1256–1257 b (
 MJup), both of which are low-mass companions moving around more massive objects at relatively wide orbits. We have reported nondetections for all of our observations. Based on the rms noise of the millimeter observations, we determined the 3-σ upper limits on the dust masses of any potential debris disks, and we compared them to the values (mostly obtained using ALMA observations) of other substellar companions (including brown dwarfs and planets) of different ages. Only three protoplanetary disks surrounding brown dwarfs have been detected at millimeter wavelengths in the literature: two around the companions PDS 70 c and SR 12 c (Isella et al. 2019; Benisty et al. 2021; Wu et al. 2022), and one around the free-floating brown dwarf OTS44 (Bayo et al. 2017) despite the fact that there are at least 30 brown dwarfs and planetary mass objects with strong evidence of hosting protoplanetary disks. This demonstrates the remarkable low luminosity of these circumbsubstellar disks, which likely become much fainter when they evolve into debris disks. Our observations of G96-3 B and VHS J1256–1257 b add up to the list of brown dwarf and planetary companions with nondetected debris disks. Assuming that debris disks scale down with the mass of the central bodies in a similar way as their protoplanetary predecessors do, we estimate that millimeter observations 100 times deeper are required for positive detections, which would open a new door for the study of the potential of these low-mass objects for generating their own moons.
More details about NOEMA can be found here: https://www.iram.fr/IRAMFR/GILDAS/doc/html/noema-intro-html/noema-intro.html
https://diana.iwf.oeaw.ac.at/data-results-downloads/ fortran-package/
The default dust parameters in the OpacityTool code are the following: dust particles’ size distribution from 0.005 μm to 3000 μm with the power law of −3.5, the porosity (so the volume fraction of vacuum) of 0.25, and the mass and volume fraction of carbonaceous material of 0.13 and 0.15, respectively.
α PsA C is the only object with a mass smaller than 0.43 M⊙. For it we recomputed the mass, using the following relation: M* = (L*/0.23)1/2.3, following the prescription by Duric (2003).
Acknowledgements
The authors are indebted to Luca Ricci, Sebastian Marino and Paola Pinilla for helpful discussions and feedback. The authors kindly thank Leonardo Tesi and Luca Matrà for providing the machine-ready tables of the protoplanetary and debris disks parameters, respectively. This work is based on observations carried out under project number W18BP [001-002] with the IRAM NOEMA Interferometer [30m telescope]. IRAM is supported by INSU/CNRS (France), MPG (Germany) and IGN (Spain). OZ acknowledges support within the framework of the Ukraine aid package for individual grants of the MaxPlanck Society 2022. MRZO acknowledges financial support from the Spanish Ministery for Science and Innovation through project PID2019-109522GB-C51. VB and NL acknowledge financial support from the Agencia Estatal de Investigación del Ministerio de Ciencia e Innovación (AEI-MCINN) under grant PID2019-109522GB-C53. BG is supported by the Polish National Science Center (NCN) under SONATA grant No. 2021/43/D/ST9/01940. JBC and JCG were supported by projects PID2020-117404GB-C22, funded by MCIN/AEI, PROMETEO/2020-080, funded by the Generalitat Valenciana, and by the Astrophysics and High Energy Physics programme by MCIN, with funding from European Union NextGenerationEU (PRTR-C17.I1) and the Generalitat Valenciana through grant ASFAE/2022/018. MPT acknowledges financial support through grants CEX2021-001131-S, PID2020-117404GB-C21 and PID2020-114461GB-I00, funded by the Spanish CIN/AEI/10.13039/501100011033. We also wish to thank the anonymous referee for constructive criticism that helped to improve the clarity of the paper.
Appendix A NOEMA and ALMA images for G196-3 B and VHS J1256-1257b
Figure A.1 shows the NOEMA images of G196-3 B and VHS J1256-1257, and ALMA image of VHS J1256-1257. No circumstellar dust emission is detected from any of these images.
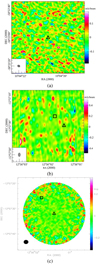 |
Fig. A.1 NOEMA image of G 196-3 B (a) and images VHS J1256-1257 with NOEMA (b) and ALMA (c). The positions of VHS J1256-1257b and G 196-3 B are indicated with triangles. Additionally, the position of VHS J1256-1257 AB is also indicated with a square in panels (b) and (c). The synthesized beam in (a) and (b) is indicated by the ellipse in the white square at the lower left corner. The beam size in (c) is shown by the black quasi-circular symbol. The flux level in mJy/beam is color-coded in (a) and (b), and in mJy it is color-coded in (c). |
References
- Alcalá, J. M., Spezzi, L., Chapman, N., et al. 2008, ApJ, 676, 427 [Google Scholar]
- Allard, F., Guillot, T., Ludwig, H.-G., et al. 2003, in Brown Dwarfs, 211, ed. E. Martín, 325 [NASA ADS] [Google Scholar]
- Allard, F., Homeier, D., & Freytag, B. 2012, Philos. Trans. Roy. Soc. Lond. A, 370, 2765 [NASA ADS] [Google Scholar]
- Allers, K. N., Jaffe, D. T., Luhman, K. L., et al. 2007, ApJ, 657, 511 [Google Scholar]
- Alves de Oliveira, C., Ábrahám, P., Marton, G., et al. 2013, A & A, 559, A126 [NASA ADS] [CrossRef] [EDP Sciences] [Google Scholar]
- Apai, D., Pascucci, I., Bouwman, J., et al. 2005, Science, 310, 834 [NASA ADS] [CrossRef] [Google Scholar]
- Baraffe, I., Chabrier, G., Allard, F., & Hauschildt, P. H. 1998, A & A, 337, 403 [NASA ADS] [Google Scholar]
- Baraffe, I., Chabrier, G., Barman, T. S., Allard, F., & Hauschildt, P. H. 2003, A & A, 402, 701 [NASA ADS] [CrossRef] [EDP Sciences] [Google Scholar]
- Barrado y Navascués, D., Stauffer, J. R., Morales-Calderón, M., et al. 2007, ApJ, 664, 481 [CrossRef] [Google Scholar]
- Bayo, A., Joergens, V., Liu, Y., et al. 2017, ApJ, 841, L11 [Google Scholar]
- Beckwith, S. V. W., Sargent, A. I., Chini, R. S., & Guesten, R. 1990, AJ, 99, 924 [Google Scholar]
- Benisty, M., Bae, J., Facchini, S., et al. 2021, ApJ, 916, L2 [NASA ADS] [CrossRef] [Google Scholar]
- Booth, M., Jordán, A., Casassus, S., et al. 2016, MNRAS, 460, L10 [NASA ADS] [CrossRef] [Google Scholar]
- Bouy, H., Huélamo, N., Martín, E. L., et al. 2007, A & A, 463, 641 [NASA ADS] [CrossRef] [EDP Sciences] [Google Scholar]
- Bowler, B. P., Andrews, S. M., Kraus, A. L., et al. 2015, ApJ, 805, L17 [Google Scholar]
- Bowler, B. P., Zhou, Y., Morley, C. V., et al. 2020, ApJ, 893, L30 [NASA ADS] [CrossRef] [Google Scholar]
- Brandt, G. M., Brandt, T. D., Dupuy, T. J., Li, Y., & Michalik, D. 2021, AJ, 161, 179 [NASA ADS] [CrossRef] [Google Scholar]
- Caballero, J. A., Béjar, V. J. S., Rebolo, R., et al. 2007, A & A, 470, 903 [NASA ADS] [CrossRef] [EDP Sciences] [Google Scholar]
- Caffau, E., Ludwig, H. G., Steffen, M., Freytag, B., & Bonifacio, P. 2011, Sol. Phys., 268, 255 [Google Scholar]
- Chabrier, G., Baraffe, I., Allard, F., & Hauschildt, P. 2000, ApJ, 542, 464 [Google Scholar]
- Chilcote, J., Pueyo, L., De Rosa, R. J., et al. 2017, AJ, 153, 182 [Google Scholar]
- Christiaens, V., Cantalloube, F., Casassus, S., et al. 2019, ApJ, 877, L33 [Google Scholar]
- Climent, J. B., Guirado, J. C., Zapatero Osorio, M. R., et al. 2022, A & A, 660, A65 [NASA ADS] [CrossRef] [EDP Sciences] [Google Scholar]
- Conway, J., Beswick, R., Bourke, T., et al. 2020, SKA Memorandum 20–21, 131 [Google Scholar]
- Currie, T., Brandt, T. D., Uyama, T., et al. 2018, AJ, 156, 291 [Google Scholar]
- Currie, T., Marois, C., Cieza, L., et al. 2019, ApJ, 877, L3 [Google Scholar]
- Damjanov, I., Jayawardhana, R., Scholz, A., et al. 2007, ApJ, 670, 1337 [NASA ADS] [CrossRef] [Google Scholar]
- De Rosa, R. J., Nielsen, E. L., Wang, J. J., et al. 2020, AJ, 159, 1 [Google Scholar]
- Dupuy, T. J., Liu, M. C., Magnier, E. A., et al. 2020, RNAAS, 4, 54 [Google Scholar]
- Dupuy, T. J., Brandt, G. M., & Brandt, T. D. 2022, MNRAS, 509, 4411 [Google Scholar]
- Dupuy, T. J., Liu, M. C., Evans, E. L., et al. 2023, MNRAS, 519, 1688 [Google Scholar]
- Duric, N. 2003, Advanced Astrophysics (Cambridge University Press) [CrossRef] [Google Scholar]
- Gaia Collaboration (Brown, A. G. A., et al.) 2016, A & A, 595, A2 [CrossRef] [EDP Sciences] [Google Scholar]
- Gauza, B., Béjar, V. J. S., Pérez-Garrido, A., et al. 2015, ApJ, 804, 96 [NASA ADS] [CrossRef] [Google Scholar]
- Guieu, S., Pinte, C., Monin, J. L., et al. 2007, A & A, 465, 855 [NASA ADS] [CrossRef] [EDP Sciences] [Google Scholar]
- Guirado, J. C., Azulay, R., Gauza, B., et al. 2018, A & A, 610, A23 [NASA ADS] [CrossRef] [EDP Sciences] [Google Scholar]
- Hernández, J., Hartmann, L., Megeath, T., et al. 2007, ApJ, 662, 1067 [Google Scholar]
- Högbom, J. A. 2003, ASP Conf. Ser., 300, 17 [Google Scholar]
- Isella, A., Chandler, C. J., Carpenter, J. M., Pérez, L. M., & Ricci, L. 2014, ApJ, 788, 129 [NASA ADS] [CrossRef] [Google Scholar]
- Isella, A., Benisty, M., Teague, R., et al. 2019, ApJ, 879, L25 [Google Scholar]
- Jayawardhana, R., Mohanty, S., & Basri, G. 2002, ApJ, 578, L141 [NASA ADS] [CrossRef] [Google Scholar]
- Jayawardhana, R., Ardila, D. R., Stelzer, B., & Haisch, Karl E. J. 2003, AJ, 126, 1515 [NASA ADS] [CrossRef] [Google Scholar]
- Kenworthy, M. A., & Mamajek, E. E. 2015, ApJ, 800, 126 [NASA ADS] [CrossRef] [Google Scholar]
- Kenworthy, M. A., Klaassen, P. D., Min, M., et al. 2020, A & A, 633, A1115 [Google Scholar]
- Kirkpatrick, J. D., Dahn, C. C., Monet, D. G., et al. 2001, AJ, 121, 3235 [Google Scholar]
- Lacour, S., Wang, J. J., Rodet, L., et al. 2021, A & A, 654, A2 [Google Scholar]
- Lindegren, L., Klioner, S. A., Hernández, J., et al. 2021, A & A, 649, A2 [NASA ADS] [CrossRef] [EDP Sciences] [Google Scholar]
- Lodieu, N., Dobbie, P. D., Cross, N. J. G., et al. 2013, MNRAS, 435, 2474 [Google Scholar]
- Luhman, K. L., & Mamajek, E. E. 2012, ApJ, 758, 31 [Google Scholar]
- Luhman, K. L., Adame, L., D’Alessio, P., et al. 2005, ApJ, 635, L93 [NASA ADS] [CrossRef] [Google Scholar]
- Luhman, K. L., Whitney, B. A., Meade, M. R., et al. 2006, ApJ, 647, 1180 [NASA ADS] [CrossRef] [Google Scholar]
- Luhman, K. L., Allen, P. R., Espaillat, C., Hartmann, L., & Calvet, N. 2010, ApJS, 186, 111 [Google Scholar]
- MacGregor, M. A., Wilner, D. J., Czekala, I., et al. 2017, ApJ, 835, 17 [Google Scholar]
- Maire, A. L., Bonnefoy, M., Ginski, C., et al. 2016, A & A, 587, A56 [NASA ADS] [CrossRef] [EDP Sciences] [Google Scholar]
- Maire, A. L., Rodet, L., Lazzoni, C., et al. 2018, A & A, 615, A177 [CrossRef] [EDP Sciences] [Google Scholar]
- Mamajek, E. E., Quillen, A. C., Pecaut, M. J., et al. 2012, AJ, 143, 72 [Google Scholar]
- Marino, S., Zurlo, A., Faramaz, V., et al. 2020, MNRAS, 498, 1319 [Google Scholar]
- Martín, E. L., Delfosse, X., Basri, G., et al. 1999, AJ, 118, 2466 [Google Scholar]
- Matrà, L., Wyatt, M. C., Wilner, D. J., et al. 2019, AJ, 157, 135 [CrossRef] [Google Scholar]
- McGovern, M. R., Kirkpatrick, J. D., McLean, I. S., et al. 2004, ApJ, 600, 1020 [NASA ADS] [CrossRef] [Google Scholar]
- McLean, I. S., Prato, L., McGovern, M. R., et al. 2007, ApJ, 658, 1217 [Google Scholar]
- McMullin, J. P., Waters, B., Schiebel, D., Young, W., & Golap, K. 2007, Astronomical Data Analysis Software and Systems XVI, ASP Conf. Ser., 376, 127 [NASA ADS] [Google Scholar]
- Miles, B., & High Contrast Imaging of Exoplanets JWST ERS Team 2023, in American Astronomical Society Meeting Abstracts, 55, 345.03 [NASA ADS] [Google Scholar]
- Miles-Páez, P. A., Zapatero Osorio, M. R., Pallé, E., & Peña Ramírez, K. 2017, MNRAS, 466, 3184 [CrossRef] [Google Scholar]
- Miret-Roig, N., Antoja, T., Romero-Gómez, M., & Figueras, F. 2018, A & A, 615, A51 [NASA ADS] [CrossRef] [EDP Sciences] [Google Scholar]
- Mohanty, S., Jayawardhana, R., & Basri, G. 2005, ApJ, 626, 498 [NASA ADS] [CrossRef] [Google Scholar]
- Muzerolle, J., Hillenbrand, L., Calvet, N., Briceño, C., & Hartmann, L. 2003, ApJ, 592, 266 [NASA ADS] [CrossRef] [Google Scholar]
- Muzerolle, J., Luhman, K. L., Briceño, C., Hartmann, L., & Calvet, N. 2005, ApJ, 625, 906 [NASA ADS] [CrossRef] [Google Scholar]
- Natta, A., & Testi, L. 2001, A & A, 376, L22 [NASA ADS] [CrossRef] [EDP Sciences] [Google Scholar]
- Natta, A., Testi, L., Muzerolle, J., et al. 2004, A & A, 424, 603 [NASA ADS] [CrossRef] [EDP Sciences] [Google Scholar]
- Neuhäuser, R., & Schmidt, T. 2012, in Topics in Adaptive Optics, ed. R. K. Tyson (Rijeka: IntechOpen) [Google Scholar]
- Pascucci, I., Apai, D., Henning, T., & Dullemond, C. P. 2003, ApJ, 590, L111 [NASA ADS] [CrossRef] [Google Scholar]
- Pascucci, I., Testi, L., Herczeg, G. J., et al. 2016, ApJ, 831, 125 [Google Scholar]
- Peña Ramírez, K., Béjar, V. J. S., Zapatero Osorio, M. R., Petr-Gotzens, M. G., & Martín, E. L. 2012, ApJ, 754, 30 [Google Scholar]
- Pérez, S., Marino, S., Casassus, S., et al. 2019, MNRAS, 488, 1005 [Google Scholar]
- Petrus, S., Chauvin, G., Bonnefoy, M., et al. 2023, A & A, 670, A9 [Google Scholar]
- Pineda, J. E., Szulágyi, J., Quanz, S. P., et al. 2019, ApJ, 871, 48 [Google Scholar]
- Rab, C., Kamp, I., Ginski, C., et al. 2019, A & A, 624, A16 [NASA ADS] [CrossRef] [EDP Sciences] [Google Scholar]
- Rebolo, R., Osorio, M. R. Z., Madruga, S., et al. 1998, Science, 282, 1309 [NASA ADS] [CrossRef] [Google Scholar]
- Riaz, B., & Gizis, J. E. 2008, ApJ, 681, 1584 [CrossRef] [Google Scholar]
- Riaz, B., & Kennedy, G. M. 2014, MNRAS, 442, 3065 [NASA ADS] [CrossRef] [Google Scholar]
- Riaz, B., Lodieu, N., & Gizis, J. E. 2009, ApJ, 705, 1173 [CrossRef] [Google Scholar]
- Riaz, B., Machida, M. N., & Stamatellos, D. 2019, MNRAS, 486, 4114 [NASA ADS] [CrossRef] [Google Scholar]
- Ricci, L., Testi, L., Natta, A., et al. 2014, ApJ, 791, 20 [CrossRef] [Google Scholar]
- Ricci, L., Cazzoletti, P., Czekala, I., et al. 2017, AJ, 154, 24 [NASA ADS] [CrossRef] [Google Scholar]
- Rilinger, A. M., & Espaillat, C. C. 2021, ApJ, 921, 182 [NASA ADS] [CrossRef] [Google Scholar]
- Schmidt, T. O. B., Mugrauer, M., Neuhäuser, R., et al. 2014, A & A, 566, A85 [NASA ADS] [CrossRef] [EDP Sciences] [Google Scholar]
- Scholz, A., & Jayawardhana, R. 2008, ApJ, 672, L49 [NASA ADS] [CrossRef] [Google Scholar]
- Scholz, A., Jayawardhana, R., Wood, K., et al. 2007, ApJ, 660, 1517 [CrossRef] [Google Scholar]
- Semenov, D., Henning, T., Helling, C., Ilgner, M., & Sedlmayr, E. 2003, A & A, 410, 611 [NASA ADS] [CrossRef] [EDP Sciences] [Google Scholar]
- Sepulveda, A. G., Matrà, L., Kennedy, G. M., et al. 2019, ApJ, 881, 84 [NASA ADS] [CrossRef] [Google Scholar]
- Shabram, M., & Boley, A. C. 2013, ApJ, 767, 63 [NASA ADS] [CrossRef] [Google Scholar]
- Stauffer, J. R., Schultz, G., & Kirkpatrick, J. D. 1998, ApJ, 499, L199 [NASA ADS] [CrossRef] [Google Scholar]
- Stone, J. M., Skemer, A. J., Kratter, K. M., et al. 2016, ApJ, 818, L12 [NASA ADS] [CrossRef] [Google Scholar]
- Su, K. Y. L., MacGregor, M. A., Booth, M., et al. 2017, AJ, 154, 225 [CrossRef] [Google Scholar]
- Sullivan, D., Wilner, D. J., Matrà, L., et al. 2022, AJ, 164, 100 [CrossRef] [Google Scholar]
- Testi, L., Natta, A., Scholz, A., et al. 2016, A & A, 593, A111 [NASA ADS] [CrossRef] [EDP Sciences] [Google Scholar]
- Testi, L., Natta, A., Manara, C. F., et al. 2022, A & A, 663, A98 [NASA ADS] [CrossRef] [EDP Sciences] [Google Scholar]
- van der Plas, G., Ménard, F., Ward-Duong, K., et al. 2016, ApJ, 819, 102 [NASA ADS] [CrossRef] [Google Scholar]
- van Holstein, R. G., Stolker, T., Jensen-Clem, R., et al. 2021, A & A, 647, A21 [NASA ADS] [CrossRef] [EDP Sciences] [Google Scholar]
- Woitke, P., Min, M., Pinte, C., et al. 2016, A & A, 586, A103 [NASA ADS] [CrossRef] [EDP Sciences] [Google Scholar]
- Wu, Y.-L., Close, L. M., Eisner, J. A., & Sheehan, P. D. 2017, AJ, 154, 234 [Google Scholar]
- Wu, Y.-L., Bowler, B. P., Sheehan, P. D., et al. 2020, AJ, 159, 229 [NASA ADS] [CrossRef] [Google Scholar]
- Wu, Y.-L., Bowler, B. P., Sheehan, P. D., et al. 2022, ApJ, 930, L3 [NASA ADS] [CrossRef] [Google Scholar]
- Wyatt, M. C., Panic, O., Kennedy, G. M., & Matrà, L. 2015, Ap & SS, 357, 103 [Google Scholar]
- Zakhozhay, O. V., Zapatero Osorio, M. R., Béjar, V. J. S., & Boehler, Y. 2017, MNRAS, 464, 1108 [NASA ADS] [CrossRef] [Google Scholar]
- Zapatero Osorio, M. R., Caballero, J. A., Béjar, V. J. S., et al. 2007, A & A, 472, L9 [NASA ADS] [CrossRef] [EDP Sciences] [Google Scholar]
- Zapatero Osorio, M. R., Rebolo, R., Bihain, G., et al. 2010, ApJ, 715, 1408 [CrossRef] [Google Scholar]
- Zapatero Osorio, M. R., Béjar, V. J. S., Miles-Páez, P. A., et al. 2014, A & A, 568, A6 [NASA ADS] [CrossRef] [EDP Sciences] [Google Scholar]
- Zapatero Osorio, M. R., Béjar, V. J. S., & Peña Ramírez, K. 2017, ApJ, 842, 65 [CrossRef] [Google Scholar]
- Zhou, Y., Bowler, B. P., Apai, D., et al. 2022, AJ, 164, 239 [NASA ADS] [CrossRef] [Google Scholar]
All Tables
Physical properties and information of millimeter and submillimeter observations of brown dwarfs and planetary-mass objects with nondetected disks.
Radius and mass upper limits and temperature of potential dusty disks around brown dwarf and planets with nondetections.
All Figures
|
Fig. 1 Observed spectral energy distributions (SEDs) of the substellar companions VHS J1256–1257 b (left panel) and G196-3 B (right panel) are shown with blue circles (measured photometry), triangles (flux upper limits), and black lines (observed optical and near-infrared spectra). The new 3-σ flux upper limits on the NOEMA, ALMA, and VLA data reported here are displayed in red color. The theoretical BT-Settl photospheric spectrum corresponding to the Teff of each target is shown with the solid gray line (Allard et al. 2003, 2012). In the right panel, we also illustrate with the dotted line the best model (photosphere and the hot ring) derived for G196-3 B by Zakhozhay et al. (2017). The solid red line stands for the SEDs of putative cold dusty disks computed as explained in the text. |
| In the text | |
|
Fig. 2 Upper limits (triangles) on the cold disk dust mass as a function of the mass of the companion for all substellar companions below ~20 MJup and with submillimeter and/or millimeter data published in the literature. The age of the systems is color-coded as illustrated by the color bar, except for our targets VHS J1256–1257 b (150–300 Myr) and G 196-3 B (50–100 Myr), which are shown with the black triangles. The left panel shows the upper limits on the dust mass in Earth mass units (MEarth), while the panel on the right shows the masses of the disks relative to the masses of the substellar hosts. Horizontal solid gray lines in the left panel depict the masses of the Moon and of the Jovian moons. The two confirmed circumsubstellar protoplanetary disks around SR 12 c and PDS 70 c are shown with hexagons. The disk dust masses were computed using the approach described in Sect. 4. Several objects, some of which are mentioned in the text, are labeled. |
| In the text | |
|
Fig. 3 Upper limits on the dust mass (triangles) versus distance for all objects of Table 1. Colored pentagons stand for the two known protoplanetary disks around SR 12 c and PDS 70 c. The age of the systems is color-coded as illustrated by the color bar, except for our targets VHS J1256–1257 b (150–300 Myr) and G 196-3 B (50–100 Myr), which are shown with the black triangles. The disk dust masses were computed using the approach described in Sect. 4. |
| In the text | |
|
Fig. 4 Measured (top panel) and relative (bottom panel) disk dust masses (pentagons and circles, ALMA detections) and dust mass upper limits (triangles, mostly ALMA nondetections) as a function of the mass of the disk-host object. Data are taken from Table 2 and Testi et al. (2022), Sepulveda et al. (2019), Marino et al. (2020), Sullivan et al. (2022), and Matrà (in prep.). Upper limits of substellar companions and free-floating objects are shown with filled and open triangles, respectively. Computations of the dust masses and upper limits are based on the assumption of a constant temperature of the disk dust (see text). In the bottom panel, the three companions of HD 8799 (c,d,e) have the same estimated dust mass upper limits; we artificially shifted them vertically so it is visually noticeable that there are three data points. The ages of the disk-host sources are color-coded (see the bar to the right of the panels). Protoplanetary disks (i.e., very young ages) have yellowish to orangish colors, while debris disks (i.e., typically older than 20 Myr) have dark red, blue, and dark blue colors, with the exception of our two targets (G196-3 B and VHS J1256–1257 b) plotted as black triangles. |
| In the text | |
|
Fig. A.1 NOEMA image of G 196-3 B (a) and images VHS J1256-1257 with NOEMA (b) and ALMA (c). The positions of VHS J1256-1257b and G 196-3 B are indicated with triangles. Additionally, the position of VHS J1256-1257 AB is also indicated with a square in panels (b) and (c). The synthesized beam in (a) and (b) is indicated by the ellipse in the white square at the lower left corner. The beam size in (c) is shown by the black quasi-circular symbol. The flux level in mJy/beam is color-coded in (a) and (b), and in mJy it is color-coded in (c). |
| In the text | |
Current usage metrics show cumulative count of Article Views (full-text article views including HTML views, PDF and ePub downloads, according to the available data) and Abstracts Views on Vision4Press platform.
Data correspond to usage on the plateform after 2015. The current usage metrics is available 48-96 hours after online publication and is updated daily on week days.
Initial download of the metrics may take a while.